


When is the best time to be bullish? When everyone is bearish! Often major inflection points occur when you have capitulation, whether that is bullish or bearish capitulation. These inflection points are always visible in hindsight and investors tell themselves they should have seen it coming. To help grasp that a major inflection point has occurred it is often helpful to study historical inflections points and compare them to the present situation. When doing so it should become clear that we witnessed another major inflection point in the stock market.
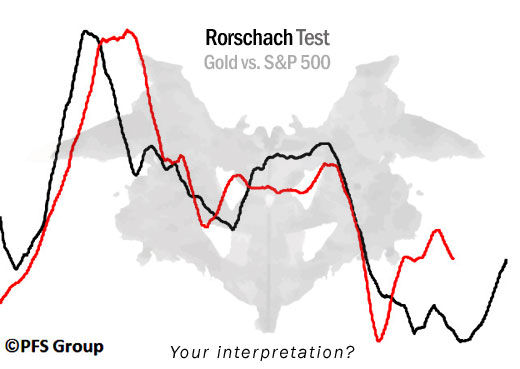
Rorschach Test
Below is an image of gold and the S&P 500, can you tell which is which?
Source: Bloomberg
I bring up the above chart because it shows one major inflection point in hindsight which no one would disagree with. Overlaid is a second set of data and the similarity between the two series cannot be overlooked and the simple Rorschach test above may perhaps open up investor perceptions if one allows for some intellectual freedom.
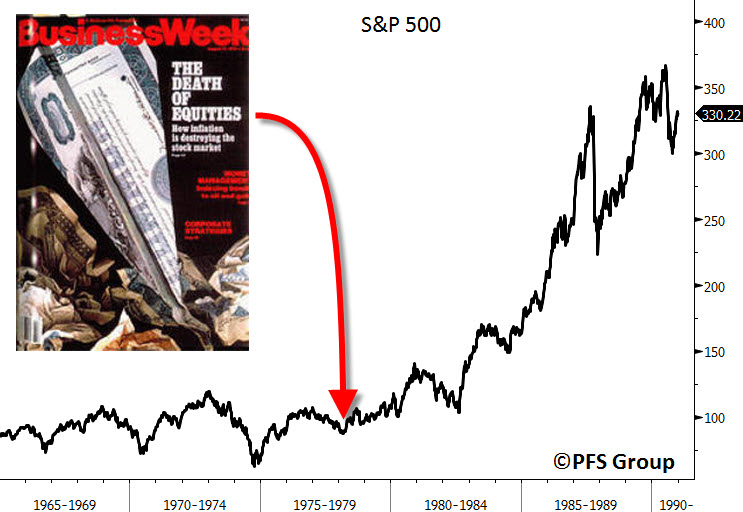
Before revealing the answer to the chart above I want to go back to the opening of this article in which I stated that the best time to be bullish is when everyone is bearish and vice versa. An example of this was near the end of the last secular bear market in stocks which lasted roughly from 1968 to 1982. After years of being ravaged by high inflation and flat to negative stock returns pessimism ran rampant and just before the US stock market entered the most bullish secular bull market in history, equities were officially declared “dead’ by a BusinessWeek magazine cover in the middle of 1979. Sentiment was so bearish and there was no visible hope of making money in the stock market back then that it seemed things couldn’t get any worse. Well, when that’s the case and there isn’t much room left to the downside there is a whole lot of room to the upside. The S&P 500 broke out in the early 1980s and had a brief selloff to test the breakout level and then it was off to the races.
Source: Bloomberg
The time to be bearish is when everyone is bullish. This was the case in 2000 when every investment author was coming out with outlandish targets for the Dow Jones to triple and quadruple in price. Sentiment had come full circle from the late 1970s in which everyone was bearish to the late 1990s when everyone was bullish and the word “value” had little meaning.

Source: Bloomberg
Back to the Rorschach test. When everyone entered the new century all the rage was technology stocks as that’s what was going straight up and making everyone look like investing geniuses. However, what had nearly the exact opposite trajectory was gold which had been in a secular bear market since peaking in 1980. Inflation was in a secular decline and central banks were selling their gold holdings and over the time period gold fell from a high north of 0 an ounce in 1980 to 1 an ounce in 1999 and then 4 in 2001 before entering a major secular bull market. In hindsight, the 2001 low was clearly the major inflection point for gold to move from a secular bear to a secular bull market.
Gold is no longer at such a cheap price as it has risen nearly 700% by almost reaching 00 an ounce last year. Likewise, the US stock market is no longer selling for rediculously high valuations as it was in 2000 and has gone nowhere for nearly 12 years. While the stock market hasn’t made any material progress over the past decade, the companies of the Dow Jones Industrial Average or S&P 500 have seen record sales, record earnings, and record cash flows which have compressed the stock market’s valuation to such a point that we have likely witnessed a major inflection point for the stock market.
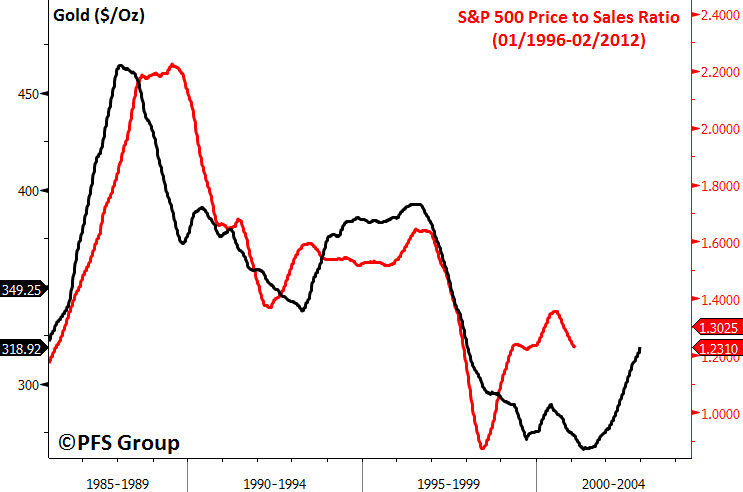
Below is the price of gold just a few years after its 1980 peak to its early 1999-2001 low, with the price-to-sales (P/S) ratio for the S&P 500 from 1996-2012 shifted back. Twelve years of rising company sales has compressed the P/S ratio for the S&P 500 to such a level that it is more than likely we witnessed the price and valuation low for the secular bear market in stocks that began in 2000, with 2009 representing the turning point for the stock market just as 2001 marked the turning point for gold.
Source: Bloomberg
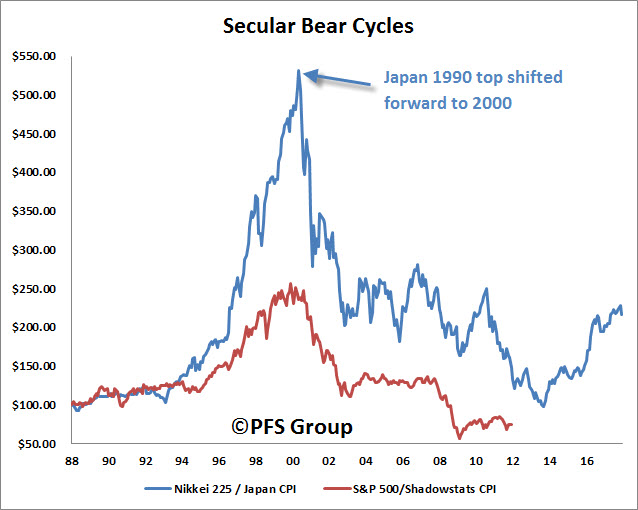
When adjusting for inflation, we can see that we have wrung out much of the prior excesses that occurred during the technology bubble and the Japanese 1980s bubble. Shown below is the Japanese Nikkei adjusted by the country’s Consumer Price Index (CPI) and rebased to 100. You can see that the inflation-adjusted Nikkei 225 at its 2009 (sifted to 2014) retraced the entire 1980s bubble and 2009 appears to be the low for Japan’s secular bear market. Likewise, rising inflation levels and flat stock market returns over the last twelve years have compressed the S&P 500 below its late 1980s levels when using the Shadowstats CPI.
Source: Bloomberg
Not only is the inflation-adjusted S&P 500 way below its 2000 levels, but in terms of relative asset value, stocks now possess higher dividend yields than US Treasuries. Over the last two decades the Dow Jones Industrial Average’s dividend yield has been higher than the yield on the 10-yr US Treasury only twice, in 2009 and the present. As shown below, the Dow’s dividend yield relative to the 10-Yr US Treasury yield is near the upper range of the last two decades, indicating that stocks at this time are very attractive relative to bonds.

Source: Bloomberg
While the Secular Low is in for Stocks, Patience Will Still Be Needed
While I believe we have seen the price lows for the US stock market we are still likely to have a few more rough years ahead of us. The price low for the last secular bear market for stocks occurred in 1974 which was followed by several more years of sharp swings in both directions. It wasn’t until 1982 that stocks finally broke the shackles of the secular bear and didn’t look back and I believe we will have a similar occurrence ahead of us. The US still has to deal with its massive debt issue and tackle out-of-control government spending. Its these issues that will likely cap the stock market in a broad trading range for several more years and exactly why active investing and stock picking will be crucial.
Dow Jones 1970s vs 2000s Secular Bear Markets

Source: Bloomberg
While it may still be a few years out before the S&P 500 clears its 2000 all-time high, that does not mean individual stocks can’t make new all-time highs and why rather than buying “the market” like the S&P 500 or the Dow Jones Industrial Average, individual stock picking will be crucial for superior performance. A perfect case in point is the comparison between the S&P 500 and International Business Machines (IBM). For the most part IBM has more or less tracked the S&P 500 from the early 1990s up until 2009. However, IBM took off like a rocket in 2009 and hit an all-time high in 2010 and has left the S&P 500 in the dust.

Source: Bloomberg
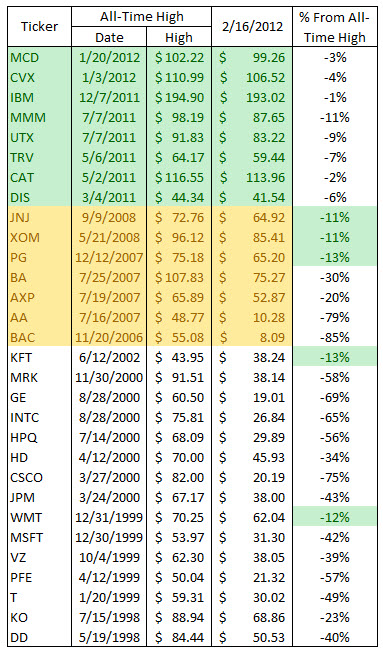
Sometimes it’s hard not to remember that the Dow Jones Industrial Average is not a stock but is composed of 30 stocks that dance to their own tune. As a major inflection point approaches like the 2000 top, individual stocks will peak ahead of the Dow and enter their secular bear markets (see table below which shows several all-time highs for its members occurred in 1998 and others in 1999). Likewise, as we get closer to the point where the Dow clears its all-time high, there will already be a large number of stocks that have already done so. This point is made clear when looking at the 30 stocks that make up the Dow Jones Industrial Average and their respective all-time highs.
As you can see in the table below, 50% of the Dow Jones Industrial Average stocks have already cleared their former all-time highs. As we progress further to the point where the broad market averages like the Dow and the S&P 500 come closer to making new all-time highs there will already be vast number of stocks who have achieved that feat and will provide outperformance.
Source: Bloomberg
The table above and the figure of IBM versus the S&P 500 make the point that stock picking will be needed for superior outperformance. Another key point to make is that in addition to stock picking, active investment management will also be crucial. Until the stock market breaks out to new all-time highs and enters a secular bull market in which buy-and-hold strategies work best, volatile market swings are likely for several more years in which taking profits after sizable market runs and reentering after big sell offs will be necessary for outperforming the market.
A key tool for knowing when to fold and when to hold are leading indicators, whether economic leading indicators or market leading indicators. One tool that has done a great job in knowing when to become aggressive and when to become defensive is the relationship between early to late-stage cyclicals whose relative performance leads the stock market by roughly nine months. The current message from the relative performance of early to late-stage cyclicals suggests 2012 may prove to be a bullish year which could see the S&P 500 up double-digits as we enter the fall.

Source: Bloomberg
Summary
2009 will likely be viewed in hindsight as the price low for the secular bear market that began in 2000 just as 1974 was for the last secular bear market. Because we are now twelve years into the present secular bear market and closer to the end than the beginning, we will continue to see early leaders that breakout to new all-time highs ahead of the stock market like IBM and why stock picking will still be crucial.
As the 1970s secular bear market price low was followed by several more volatile years of market swings, the 2009 low will likely to be followed by several more years of double-digit price swings in both directions. With several more volatile years ahead of us before the broad market averages make new all-time highs, active investment management in which profits are taking and redeployed later after selloffs will also still be important for investment success and beating the markets. This was the case in which gold bottomed in 1999 but didn’t take off right away. Instead, it took another three years before gold never looked back and began its strong run.
With leading indicators (both economic and stock market) suggesting we have a bullish period ahead of us, the stock market looks good right now and should continue to advance before active investment management will be needed to book some gains.


