


The Market Vectors Gold Miners (GDX) exchange traded fund has attempted three times in the past year to exceed its 2008 highs but has failed on each attempt. Prior attempts occurred after prolonged rallies that had exhausted much of their energy just to reach the 2008 high. However, in the present case the GDX is oversold on an intermediate basis and yet it is only a stone’s throw away from its former all-time high. What this means is that it could retest its former highs and still not be overbought, leaving plenty of energy left to rally further before becoming significantly overbought and depleted of much of its momentum. Perhaps the fourth time is the charm for precious metal stocks?
Signs of an Intermediate Low
On July 28th the GDX made a fresh low after peaking in late June, and yet the percentage of stocks within the GDX making one month lows did not follow suit. What this means is that precious metal stocks within the GDX were bucking the overall trend which typically occurs when a correction is nearing its final innings. This is what we saw back at the February lows and the current situation looks like a mirror image.

Source: Bloomberg
Confirming the underlining strength in the GDX not reflected in its price is that the percentage of stocks within the GDX that were above their 20 day moving average (20d MA) was rising sharply while the GDX remained below it. The 20d MA breadth monitor for issues within the GDX is a good short-term breadth measure, while the 50d MA breadth monitor is a good intermediate breadth measure.
Looking below, we see a potential timely setup for precious metal stocks when viewing short term and intermediate term breadth monitors. The strength in the 20d MA breadth monitor signifies a short term low is in and stocks are likely to continue to advance, while the oversold nature of the 50d MA breadth monitor signifies precious metals are still very oversold on an intermediate basis and have plenty of room to run before becoming overbought (breadth levels > 90%).

Source: Bloomberg
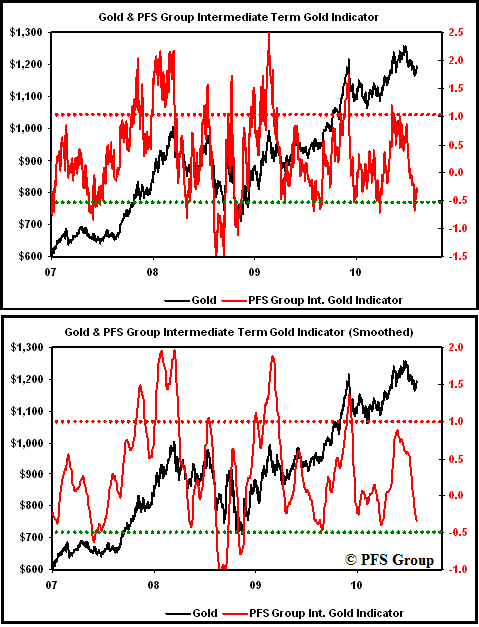
In addition to an intermediate low likely at hand in precious metal stocks, gold bullion may also be at an intermediate low and strength in gold should be a tailwind to precious metal stocks. I’ve created a technical composite for gold which is based on trend deviations and relative strength ratios, and has done a fairly good job in identify tops and bottoms in the past. Significant tops typically occur when the ratio rises above 1.0 while major intermediate lows typically occur when the ratio falls below -0.5. As can be seen below, the last time gold was this oversold was in March of this year when it was below 00/oz and before it rallied to an all-time high.
Source: Bloomberg
There are no guarantees that gold is going to go screaming northward from here, but what the technical composite above does suggest is that much of the price risk of gold has been worked off. Readings between -0.70 to -0.50 have marked most of the prior lows, while the significant decline in 2008 saw the indicator fall below -1.5. If gold is to rally from here the 50d MA needs to be broken to the upside and the 200d MA needs to hold. A break above the 50d MA (11/oz) would confirm an intermediate low is in while a break below the 200d MA (48/oz) would indicate more work needs to be done before a significant low is in.

Source: StockCharts.com
Seasonality is Bullish
The same conformational trends can be said for the GDX in which it needs to close above its 50d MA to confirm a low is in, while a break below its 200d MA would signal the recent correction has further to run. That said, we are now entering the seasonally strong period for precious metal stocks which would suggest a breakout rather than a breakdown. Four of the five strongest months for the AMEX Gold Bugs Index (HUI) occur between now and the end of the year with only one negative month over the period.
AMEX Gold Bugs Index Monthly Seasonal Pattern (% Chg)

Source: Bloomberg
The HUI typically bottoms in late July and then rallies through the end of the year and we appear to be following the historical script right on cue if the lows seen in July hold.

Source: Bloomberg
In addition to a break above the 50d MA for gold and gold stocks, other signs of bullish confirmation would come by breakouts in various precious metal relationships that would signify healthy levels of risk appetite. For example, peaks in gold stocks often occur when they begin to underperform gold bullion (orange second panel below), which often coincides with weakness in silver bullion relative to gold bullion (silver third panel below). This is what occurred at the tail end of 2009 in which gold stocks and silver bullion were both underperforming gold bullion. Since then both relationships have been in declining trends and a break to the upside would be a healthy sign that a low is in as both gold stocks and silver bullion outperform gold in strong up markets for precious metals.

Source: Bloomberg
What has me leaning towards a bullish resolution for the gold stocks to gold and silver to gold relationships is that the junior space (using GDXJ as a proxy) is outperforming its larger cap brethren stocks, showing a healthy risk appetite is present in the precious metal markets.
To summarize the comments made above, there is sufficient evidence at hand that gold and precious metal stocks have made an intermediate low with precious metal indexes likely to assault their former highs at a minimum, while a breakout to new all-time highs is also conceivable. To confirm that a low is at hand I would use a weight of the evidence approach in which multiple confirmations are used. The signs to confirm an intermediate low is in that I would be on the lookout for are the following:
- A breakout above the 50d MA for gold
- A breakout above the 50d MA for precious metal indexes
- A breakout in the gold stock to gold ratio
- A breakout in the silver to gold ratio
If these breakouts occur collectively we can make a reasonable assumption that precious metals have bottomed and are likely to advance to their former all-time highs and potentially exceed them.
Caveat Emptor
Keeping an eye on the big picture is a vital exercise so that one is not caught off guard and to help one from blindly chasing the market. While there is a lot of evidence to suggest precious metal stocks may put in a strong rally ahead, there are a few things to be aware of that could throw a wrench into the equation. The USD is very oversold after nearly a 10% decline in the span of two months, and is testing its key 200d MA and ripe for a rally.

Source: StockCharts.com
A rally in the USD typically coincides with a correction in gold stocks but these are interesting times in which the USD and gold and gold stocks have been moving in the same direction. For example, the correlation between gold stocks (GDX) and the USD has been completely turned on its head from a negative correlation to a positive correlation in the last few months in which the movement in the USD explains 72.7% of the movement in the GDX. Suffice it to say, watch the USD and whether the negative correlation between it and gold stocks returns.

Source: Bloomberg
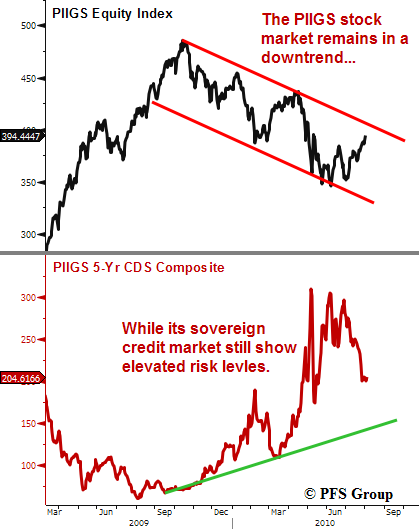
Another area to keep an eye on is the trend in the PIIGS equity markets which have been the center of attention this year in which peaks in the PIIGS index composite I created below coincide with peaks in global equity markets. The credit risk for these countries’ debt remains elevated when viewing the credit default swaps (CDS), which means the road to global stock market recovery remains cluttered.
In summary, there is ample evidence to suggest a significant low for precious metal stocks and gold bullion is in, though look for confirmation and keep an eye on precious metals reaction to the movement in the USD, and keep an eye on the PIIGS.


