


We know already that market timing is a fractured and much tortured topic. Most traders and investors have at some time or other dedicated large chunks of their resources to the search for that almost mythical creature the markets’ clock. That it has been hiding in plain sight for 26 centuries simply makes its allure more powerful.
 Many seasoned advisers scoff at the notion that market timing even exists, let alone that it is possible. I call this and similar views, the “Columbus Doctrine”. This doctrine states that “If I don’t know how to do it; it can’t be done”. Columbus sparked the most historic moment in the doctrine’s long history when he actually sailed off the edge of the world (it was widely believed to be flat in 1452) and miraculously returned to Spain. His reward was riches, fame and honour. Though not the first to reach the Americas from Europe, that being Leif Ericson, Christopher Columbus is remembered on Columbus Day whilst poor old Leif languishes as a footnote in history. Even 7 centuries ago, a good PR agent was paramount!
The Columbus Doctrine is not only alive and well today, it is the favourite tool of those whose hubris denies them the chance to learn. And as you will see, there is much to learn. Our theme picture today is again the magnificent Sistine ceiling (1508-12) painting of the Prophet Danielby Michelangelo.
S&P Update
In my recent article for Financial Sense, “Master Class-It’s about Time”, I showed you the Danielcode timing cycles for the S&P, how to calculate them and the rules. To update that report, the following chart takes the 6 trading day bar which constitutes DC “time”. More than 1 arrow constitutes an Amos cluster (see “Master Class”, FSO archives 05/15/09), where 2 or more degrees of DC cycles expire. If you have not already read “Master Class”, none of what follows will make much sense, so that should be the starting point of our little discourse today on market timing.
Note that we now have 2 degrees of DC time cycles expiring on 06/09, that is next Tuesday, so watch for a significant sell signal in S&P during this window.
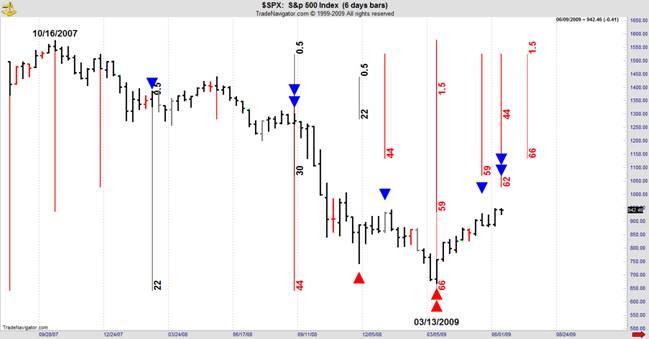
On this chart the next cycle after the Danielcode call for a significant low on 03/06/09, came in the week of 05/08/09. On the shorter term 3 day chart, we had three DC week cycles all expiring in that week. In fact it was a little better than that. The chart below converts the 3 day chart to daily:
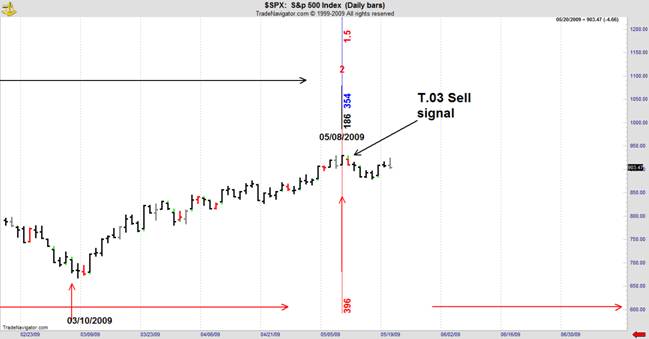
All of the important cycles on the fast chart expired on Friday 05/08/09, and that combined with the DC price targets triggered a T.03 Sell signal for the following Monday. To trade time cycles you still need price action to create your entry, and from there it is a matter of each trader’ own style and stance. Swing traders will hold for the longer pull, whilst shorter term traders would be looking for the fast daily signals which the T.03s are, and be trading both ways. Below we see how the T.03 sell from 05/11 took this market down to the 50% retracement of the minor swing. The next T.03 signal, a buy for 05/18, was elected on that day and took us to the DC black line at 924.53.
I have written often about the power of the DC black line and you see it here turning back last Wednesday’s rally 7/100ths from the $SPX (index) target. Since the futures only trades in tenths, we can effectively call that zero variance. The intermarket correlations are also evident here. A T.03 signal in any of the major US equity indices, and Germany’s DAX can be executed in others of the group.

How you trade the Danielcode signals is a matter for you. There are opportunities to use the DC price targets for swing trading, short term trading and even options, although futures are always my preferred poison.
The Danielcode is not a “learn to trade” website, although many do learn this way. It essentially provides a consistent flow of very different market information that others do not see, and you can incorporate that information into your trading plan to give yourself the all important traders’ edge.
What we got from the 05/08/09 cycles was a minor countertrend. Whilst time cycles, be they from the Danielcode or others, are joyous and illuminating to behold, on their own they tell us nothing about quantum. Only price action confirms or rejects cycles and measures how important the turns they create will be.
44 Gold
From the S&P we progress to the Danielcode time cycles in Gold. Again we start with the 6 trading day chart as discussed in my previous article. There are subtle differences in how markets react to these cycles but all react. Gold’s particular personality is that it doesn’t have the same institutional memory that we see in the S&P cycles.
 Although they are the same cycles, with S&P we first seek recognition then repetition and reaction. Gold just reacts! It’s quick and dirty and far less satisfying intellectually, but that’s what it does and if you think about that particular quality, you will see the nuanced differences in market participants.
Last week’s “Master Class” article certainly created some interest. I had a large response from strangers and members alike. As usual they ranged from the “Great job Mate” to the “What are you smoking” variety.
Gold mavens swamped my letterbox with demands to see the Gold cycles, so here they are. To me, the Danielcode time cycles are more than great intellectual exercise and a significant trading edge. They are continuing evidence of Sir Isaac Newton’s definition of the true purpose of Science.
“When I wrote my treatise about our System I had an eye upon such Principles as might work with considering men for the belief of a Deity and nothing can rejoice me more than to find it useful for that purpose.” Sir Isaac Newton
I love to see markets reacting to these secret and almost wholly unknown numbers from the Book of Daniel. You on the other hand are a much more feral breed whose constant refrain is “Show me the money”. So here it is; The real Gold cycles in all their glory! Whether you need these cycles to hone your awareness of market moves or just for cocktail chatter to impress that bright young thing, they are certainly fun. Knowledge of markets’ time cycles, uttered in a dark and raspy tone will make you appear omnipotent beyond reason. They are a great conversation piece as well as a source of considerable treasure for those who know.
For serious students of time travel, I repeat that time cycles are just vibrations in the market’s internal body clock. The significance or otherwise of time cycles are only validated by price action.
Do Time Cycles even matter?
Let’s start with the simple version, and ask the question “Do time cycles matter?” There is a bipolar approach to time cycles in the investment community. A great trader and teacher once told me that as a younger man he got heavily involved with the quest to discover and profit from the knowledge of time cycles. He was sure that time alone was the key to fame and fortune. He joined a group of budding young traders and analysts who met weekly to try to find the keys to this hidden kingdom. My friend, assiduously rode his bike to the café where this particular group met, every Wednesday, as they attempted to illuminate Fibonacci’s numbers and related fractals as they applied to market timing in the S&P.
After some months he became disenchanted by the lack of any real progress. He noticed that his fellow time cycle enthusiasts looked rather down at heel. Indeed he said “scruffy”. He concluded that they were not profiting from their research and abandoned any further interest in “time”. And he was right. Toil as you might, with Fibs and Fib ratios of previous time ranges in your ceaseless quest for trading knowledge, you will first lose patience then money and finally you will lose your mind. These guys simply had the wrong tools. The probabilities of fitting a square box into a round hole, or better still a convex binomial cone are not great. In fact that particular probability, which you will know if you have dabbled in “time”, is exactly zero!
But that was before the Danielcode. Let’s start this week’s voyage of discovery by looking at the 12 trading day DC “time” chart of Comex Gold. Recall that from the rules set out for you in “Master Class” our basic timing block is 6 trading days. That makes a Danielcode “week”. We can, under our very specific rule of “time, times and an half”, validly manipulate our basic building block to 12 days being “times” and 3 days, being “an half”. The same applies to the DC time cycles.
What we are asking here is actually a series of related questions. Firstly are time cycles a relevant tool. Secondly, are they precise enough to warrant the work required to calculate them and keep the additional charts, and thirdly, are the simpler forms of this type of analysis, within the capabilities of the average private trader?
Take a look at the 12 day or 2 DC “week” time chart of Comex Gold below, which captures the past 18 months price action. This is “time” charting in its simplest form. Note that these bars are each 12 trading days so they merely create a window of expectancy or possible opportunity. You still need the specific trade entry signals, either a standard DC turn or a T.03 trade signal to trigger that opportunity. Then such a signal is itself conditional and not valid until elected, and then possible outcomes of the trade are many. So at best, knowledge of time cycles is just another step in a series of conditional variables that that will create the trade. But you be the judge as to its worth.
If you have answered yes or “possibly” to the questions I have posed, then we can hone in much more closely than the 12 day window, but let’s start at the beginning.

To create this chart, we have used only the DC 44 time cycle which is Gold’s base vibration. All of the sequences shown here are derived from the price structure around the 05/12/06 high, and this chart is in semi log scale.
From the 03/17/08 high we have 8 significant swings marked with the blue numbers. Using just one Danielcode time sequence and the matrix around one significant chart feature, we can satisfactorily account for 7 of the 8 important swings that have materialised since the March ’08 high. The swing point marked 3(ii) actually comes from a 44 cycle but it is on the 3 and 6 day charts. It is not identifiable as a cycle swing on this chart.
So, the question is, would this knowledge be helpful to traders and investors? Put another way, would it have been advantageous for you to know what these cycles are and how they operate to define important swings? For short term traders, probably not. But for longer term investors and long swing traders, the answer is a resounding yes.
The next chart goes back a bit in time and shows the 44 cycle count coming from the structures around the highs in January and December 2004. We get a number of minor highs and lows culminating on finding the May 2006 high and the next low. From this we can learn two things. Firstly the only cycles that are vibrating on this piece of chart are the 44 DC “week” cycles and secondly that the structure around May 2006 will likely be an important structure for the next group of cycles.

In regard to our first observation, a healthy cycle chart should have most of the cycles evident although some will be dominant at various times. We only have the 44 cycle identifiable on this piece of chart. That means that this market is likely faster or slower than our standard 6 trading day week. The rules allow us to slide the time frame so long as we adhere to our “Time, times and an half” command. We see from the latter part of this chart that Gold is increasing its daily ranges and hence its volatility, so the odds are that it is running faster. That means that we can look at a chart based on 3 trading days or “an half” of our base time unit.
Here is the same chart converted to 3 days and moved along:

Now we can see the 59 cycle working. From the 03/01/07 high we get a 59 cycle expiring at “times and an half” right on the high at 03/17/08. We also have the old 44 cycle, this time the 4th iteration, expiring on the same day. So we have an Amos cluster at the eventual high. With this cycle count and price at an important DC target I called in a Financial Sense article, for this to be an important top and for the US Dollar index to bottom on the same day (FSO archives 02/29/2008). The call for a DX low on 03/17/08 was actually made with the target price in Financial Sense almost 6 weeks before it happened! More detail on how that call was put together appears later in this article.
From the March 2008 high we get another 2 cycles expiring at 07/14/08 and 07/22/08. Split the difference and that gives us the next high. The low between these highs comes on 05/02/08 at the 4 “times” the old 44 cycle, now counting 88 as we have halved the time period, and the next two significant highs on the chart also come off the continuing 44 count.
Now we can look at the DC time cycles from the May 2006 high. It is the last significant structure on the Comex Gold chart before this market went parabolic into the March 2008 high. As such it is a magnet to start our DC cycle counts although not to the exclusion of earlier counts still running below the radar.

For the Gold cycles, we are just using the same cycles that I showed you last week. All in the special Danielcode “weeks” that I showed you in last week’s article for Financial Sense. Don’t worry about the colour coding. There are conventions for colours, the 44 cycle is red etc., but I am just using different colours here to make the cycles easier for you to follow.
Starting at the top of the chart, the black 62 period cycle gives us a low at 1.5 times and the top at 2.5 times. Note that this is not the death spiral or crash count that the 59 cycle from high to high portends. That setup must happen on the first hop. Combine these charts and you have every significant turn in Gold with just 3 time cycles. Bet that’s a surprise.
All of these cycles that I am showing you are static, or fixed time periods. We use different techniques to chart the fractals of previous ranges in “time”. Whilst all ranges are fractals of previous ranges both in price and in time, the number of ratios that markets give us when using the “previous time/fractal method” creates so many choices that they are not really useful. By limiting ourselves to just the 3 major static time cycles for this market we already have very busy charts. At some stage, more information becomes counter productive, at least to my mind. There are finite limits to what we can absorb and therefore to what information is useful.
Below is another 12 day or 2 DC “week” chart which only uses two of the Danielcode time cycles. This chart is on a semi log scale and identifies almost every important turn from 2003 to date. All of the important turns come from the 44 DC “week” cycle. All markets have their own internal vibration.
For Gold it is 44.
WD Gann alluded to this phenomenon when writing about his “Law of Vibrations” but did not nominate what those vibrations were. In fact he said we were not ready to know. That’s a bit like giving you a lovely car with no engine; attractive but useless. But that was ever a Gann hallmark. Gann, like many still today was really in the business of selling product, not transferring knowledge.
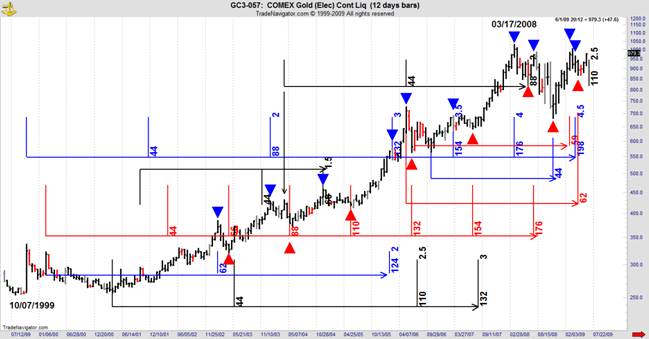
You see from the beginning of this chart that the low at 10/07/1999 is an important market structure. Turning back the clock we see how that low too arrived at the right “time”. We had three separate degrees of DC time cycles from the structure around the March 1993 low and April 1993 high expiring almost simultaneously at the July 1999 low. Amos strikes again Roger!

And finally before you ask the obvious question, yes, the spike high on 10/07/99 also came at the expiration of 3 degrees of time cycles. Back to the DC “weekly” or 6 trading day chart shown below. For those with keen eyesight, note that the 74 DC week cycle into low came from the closing low of 02/10/97. If we had used the swing low then we have a 1 period variance at the 10/99 high, which is also acceptable.
For those interested in emulating this technique, the single variance or “fudge factor” acceptable, is that the cycles can begin from a statistically significant swing high or low or from the closing high/low within that structure. That mirrors the occasional quirk in the Danielcode price levels that DC members are familiar with. Occasionally market recognition of the DC price levels will be achieved at the close of a price bar rather than the more usual bar high/low. And so it is with the DC time cycles, which is consistent. This anomaly makes a variance of +/- 1 period bespoke.

HUI Index
So far we have seen the static DC time cycles defining the S&P index and Gold. If the Danielcode time and price sequences are truly valid, they should also define the HUI index and other markets. In fact all of them. HUI, I know is of great interest to longer swing and options traders. As usual we start with our 12 day DC “times” chart. We can find 10 significant turns with our base 44 cycle from the 10/98 top.

We can then add more 44 and 62 cycles from significant highs and lows. In the chart below we see the conjunction of several degrees of DC cycles giving us Amos clusters at the important turns. In the Aussie vernacular, “What a Beauty!”
Do you still believe in Fibs and Random Walk Theory? If so, it’s my turn to ask “What are YOU smoking”!

DX
Continuing with our theme of proving the proposition by applying it to alternate markets, we move on to the presently all important US Dollar Index. Here are the major Danielcode time cycles for the US Dollar index on the DC “weekly” chart. 
This is an extract and the relevant chart from my 02/29/2008 article “Crash! The Fat Ladies Open Down Under” published exclusively by Financial Sense (see FSO archives):
“The dominant story this week for forex players has been the continued demise of the US Dollar. With DX (NYBOT Dollar Index) breaking to historic lows some months ago, this market is searching for the next level. The major Daniel monthly number sequence has picked 4 of the 5 trading levels in this market since its top in 2001 with other support levels being made at intermediate Daniel sequence numbers. The numbers suggest a continued long term decline until at least the next Daniel support at 70.40.” 
So we had a Danielcode price target from the monthly chart of 70.40 and time cycles from the 6 day chart expiring on 03/12/08 and 03/20/08.
Zooming in to the 3 day or “an half” time chart, we had the 59 cycle from the high after the high expiring on 03/12/08 and the half cycle of 44 rolling at 03/17/08 and running on to define most of the inflection points in DX. Recall that we already had 2 degrees of the 6 day cycles expiring on that date. And on 03/17/08 we got that magical meeting of time and price as DX made its low at 70.70 on the cycle dates, just 30 ticks from the monthly DC projection nominated in February.

And that folks, is how the Danielcode called the low in DX for Financial Sense readers last year, and which because of its then lockstep with Gold, also allowed me to call the tops in Gold and Silver. And it is all math. No opinion, just the Danielcode numbers.
Last December, in “Tyranny of Numbers”, (FSO archives 12/05/08) I told you that the Danielcode target for DX in the rally was the famous DC black line at 90.22. The high in March 2009 was 89.63, basis the index, 89.71 basis the continuous contract and 90.31 basis the June futures contract. How was that for a market call 3 months in advance Mo? Sadly, the chart below shows what is happening to this mighty symbol of economic hegemony.

Crude Oil
And for Crude Oil speculators and traders, if you knew nothing, except how to construct a Danielcode “time” chart and count to 44, you knew not to buy Oil or Oil stocks near July 2008 or sell them near February 2009.
Fortunes have been lost by major players and investors for want of this knowledge. Importantly, the final DC cycle to create the Amos cluster in July 2008 was finalised as soon as the January 2007 low was formed and that process completed with the 03/07 bar. So as early as March 2007, a clear 16 months before the eventual top, we had the Amos cluster dates for a major turn in July 2008, set in stone. And it wasn’t going to be a low, was it? When multiple degrees of DC time cycles expire at a Danielcode price level, a trend change is the highest probability outcome. At such times, hedging and hard hats become de rigour!

This extract and the following chart are from “Le Tour Toujours”, written exclusively for Financial Sense and published on 06/28/2008 (see FSU archives):
Did you get the top? In my 6th June article for Financial Sense “Charting around Asia-Worlds Collide” I showed you the following chart. This is the continuous chart for Crude Oil futures. At that date the Daniel number sequence had already identified the interim top at 135.14 and the retracement turn at 121.43. The next upside target for the Danielcode was 148.05, in dark blue to show that it was the dominant sequence with the comment “Oil continues to be strong on the weekly chart and higher targets are on the chart.”

July’s high in Oil came at 147.90 just a few ticks from the major DC target.
Add the DC price targets to the DC time chart and you can see why the Danielcode suggested that 8 in July 2008 was a high probability for as at least an intermediate top in Crude Oil.
Time and Price; the Grail of markets and their watchers. S&P, Gold, HUI and Oil. These are just a few examples of how the markets’ clock runs. And they told you it couldn’t be done!
If you are tempted to play with this stuff, be careful. It is a form of prophecy and as such practitioners must be ever mindful of Sir Isaac Newton’s caveat:
“The folly of Interpreters has been, to foretell times and things, by this Prophecy, as if God designed to make them Prophets. By this rashness they have not only exposed themselves, but brought the Prophecy also into contempt. The design of God was much otherwise. He gave this and the Prophecies of the Old Testaments, not to gratify men's curiosities by enabling them to foreknow things, but that after they were fulfilled they might be interpreted by the event; and his own Providence, not the Interpreters, be then manifested thereby to the world. For the event of things predicted many ages before, will then be a convincing argument that the world is governed by providence.” Sir Isaac Newton, the Father of Modern Science
Do not expose yourself to folly.
This is just a précis of an enormous subject. There are other DC cycles and with sufficient computing power, we can morph the time frames so we have different degrees of cycles playing out on 3, 6 and 12 day charts, and all working together. We can use 3, 6 and 12 DC “weeks” as well. That is something to behold, but it is far beyond the scope of this article and not possible to show in this format, but perhaps you can conceptualise such a display.
I trust you have enjoyed this brief illumination on this somewhat arcane but most important subject. It is possible to know much more about markets than you ever believed, and I hope these two Master Class articles, written exclusively for Financial Sense, have at the least, shown you what is being done every day at the Danielcode, where we use the same but much faster evolutions of these cycles as a primary input to create members’ T.03 trade entry signals.
My hope is that these articles serve to open your minds to the vast opportunities that a proper understanding of “time” bestows. I hope this view of what is possible will overcome the Columbus Doctrine and encourage you to go where perhaps you have not been before in your study and appreciation of markets. I assure you it is an exciting and worthwhile journey.
Coming to America
I will be visiting the US in June and July, and hopefully making a second visit in September. I will be in Redding, CA on 25-30 June, Omaha, 1-5 July and Colorado Springs from 7-13 July. I will be hosting the Danielcode intensive 2 day Super Traders’ Tutorials in Redding and Colorado Springs, as well as running some free 1 day seminars on trading the Danielcode T.03 signals for all who are interested.
I would like to meet as many of you as possible, so if you are within travelling distance of any of those locations, please come and say hello. Take a break and bring your wife, girlfriend or significant other. Whether your interest is the intensive DC trading tutorials which will put you on the path to becoming a master trader, or learning how to properly trade the T.03 signals, or just a cold beer and a yarn about markets, trading, horses, offshore yacht racing or Rugby, it will be a pleasure to meet as many of you as possible.
Email me for details of the seminars and tutorials. Or where we can meet for a cold beer.
To finalise this 2 part series of the Danielcode Master Class on “Time”, let me remind you of the power of the Danielcode. Here is the dreaded DC 59 crash count from high to high, mentioned above, that foretells doom for markets. We saw this awful apparition in the S&P at the 2007 top. This is the 1929 top in the Dow that prefaced the Great Depression. In this incarnation we have the DC 59 time cycle running from the closing high of the 11/1924 price structure to the 09/1929 top on 4 “times” the standard DC week, or the equivalent of a monthly chart. The 1924 structure doesn’t look significant here, but isolate it without the lunatic 1929 peak and you will see that it was.
At the DC 59 “time” cycle expiration we get Armageddon and the 1932 low comes precisely at “an half”. So we close the circle to where we started. Dan 12:7 “And I heard the man clothed in linen, which was upon the waters of the river, when he held up his right hand and his left hand unto heaven, and sware by him that liveth for ever that it shall be for a time, times, and an half;” Believers now?

3 John 1:14 But I trust I shall shortly see thee, and we shall speak face to face. Peace be to thee.
Copyright © 2009 John Needham


