


In the previous Danielcode articles I introduced you to the theory and origins of this concept and highlighted its historic accuracy over differing periods from 10 year trends to 4-hour charts. As the proof of the pudding is always in the eating, I bring you today actual trades and results from our members' charts. You will decide whether my claims that the Daniel number sequence creates unique price levels that the market recognizesbut that are unknown to others is justified. I talked also of the accuracy and precision of the Daniel numbers. A target for a reversal or continuation must be more specific than "thereabouts".
Because of the importance of Asian trade to Australia and New Zealand, more than half the crosses I cover involve Asian currencies. Later in the month I will have the pleasure of writing for Financial Sense's ASIApage so I will keep most of the Asian charts till then. This is an exciting opportunity. Forex trading in Japan is a sensation. Recently the BBC or Jim Lehrer Hour (my correspondent was not sure which) aired a documentary on the phenomenal growth of interest in forex trading in Japan. The twist was that most of the new interest is coming from women. It really shouldn't be a surprise as the Japanese invented charting patterns with candlesticks developed by merchants and speculators for the early Rice trade and the changing face of Japanese Society is encouraging women to access previously male dominated areas.
Possibilities of the Danielcode
The extreme accuracy of the Daniel number sequence raises many possibilities. On a daily chart, reversals, if they happen at all will happen within about 60 ticks (pips) of the Daniel number. If you review our current trading reports you will see chart after chart turning at these numbers. On 30th December I reviewed the results of 11 forex pairs members were trading from the Daniel numbers. Of those, 8 of the charts turned within 30 ticks of our target, one at 49 ticks, one at 6 ticks on a close only basis and the other was a continuation. In that weekly review there were over 3500 ticks available to DC traders. How much of that you got is a function of your own skill and trading stance. On 2nd January I reviewed another 10 Danielcode trades from members' charts. In this group, there were 13 reversals within 20 ticks of the Daniel number and 1 at 28 ticks. There were another 1000 ticks available from these trades by the close Tuesday and the GBP-JPY trade went on to make 15 big points or 1500 ticks by the close Friday. These are all real time trades with the appropriate Daniel sequence posted for members well in advance.
These reports are available to all on the Danielcode website. You be the judge.
The common factor here is the identification of the "action zone" within 40 ticks either side of the Daniel number. In practice I expect a reversal, if there is to be one to occur within 30 ticks. In fact I rarely highlight a chart that turns outside a 30 tick range from our number.
Let's consider what this means. We can reduce the trading choices to just two:
- If we are going to get a reversal there is a very high probability that it happens inside a small space 40 ticks either side of the Daniel number. Some may prefer +-30 or 50 that is your choice. The percentages actually say you will get 80% plus of the turns within 30 ticks.
- If we don't get a reversal within that range, our assumption is that the trend continues intact.
From these parameters we can be prepared for a reversal if the appropriate signal is given within our "action zone". Absent a reversal we have a high probability continuation trade as the other extreme of the action zone is taken out.
Below is the GBP-JPY trade from the member's charts. Get out your charts and follow this sequence. It is well worth your time. The trade ran from its 14 December turn 40 ticks above the 229.67 Daniel number through 4 swings on this daily chart to make its Friday low just 14 ticks from the 213.61 number. In the process it reversed at 4 separate Daniel numbers. The variances from target were 1, 13, 3 and 52 ticks respectively! Every price target was recognised with exactitude.

The weekly chart below, posted on 29th December showed that the weekly targets were 220.37 which precipitated the bounce on Tuesday and Wednesday morning as this Daniel number was recognized with a 220.92 swing low on Monday, then 214.49. The weeks' end close on Friday was 214.32.
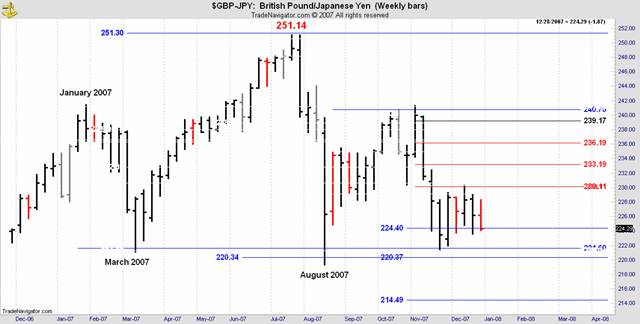
The trade made 1700 ticks from high to low plus the squiggles.
Christmas and New Year Markets
While awaiting the Financial Sense Asia article I just have to show you this classic trade from the Weekly and Daily charts in the Danielcode Report posted on Christmas Eve. The next two charts are straight out of that report:
JPY-HKD Perfect trade from the July high. Now at support.

JPY-HKD Daily. Can't do better than this!! Watch the support.

"Now at support! Watch the support!" said the commentary. It was a lovely trade down from the Daniel number at 72.25 that caused the reverse at the high. About 400 ticks at .00 per tick... hmm. But the Daniel numbers are market definers so with this market holding its lowest close just 8 ticks from the Daniel number we were on high alert for a reversal. This is what happened:

400 ticks down; 400 ticks up; where did it go? 0.07226. Just 1 tick past the old Daniel number that brought in the July high!! Do you think the market knows these Daniel numbers? Oh Yeah!
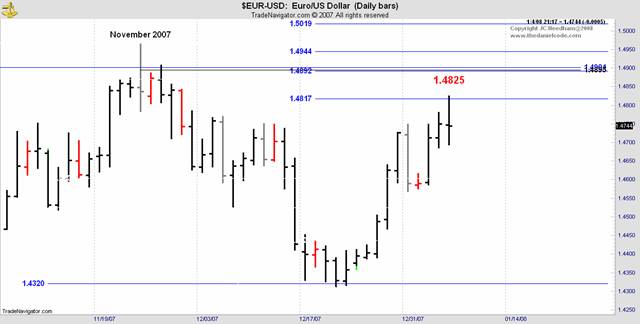
On 24th December we posted the following chart to show that EUR-USD was turning from the Daniel number at 1.4320:

This was easy as the 1:1 ratio was sitting at 1.4308 so many saw this basic setup. We nominated the upside targets on 31st December and Friday's high (chart below) was just 8 ticks through the next Daniel number giving a nice trade of 800 points.
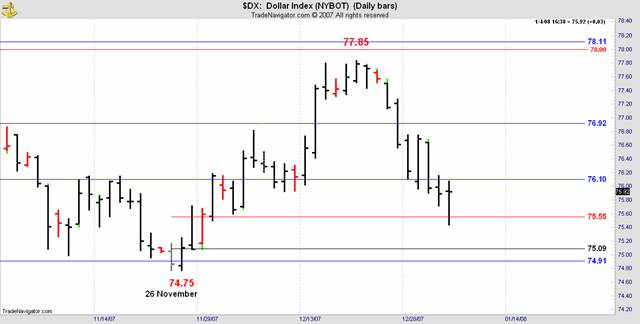
On Christmas Eve we posted the following Weekly DX chart showing USD approaching multiple Daniel targets clustered from 78.00 to 78.11.
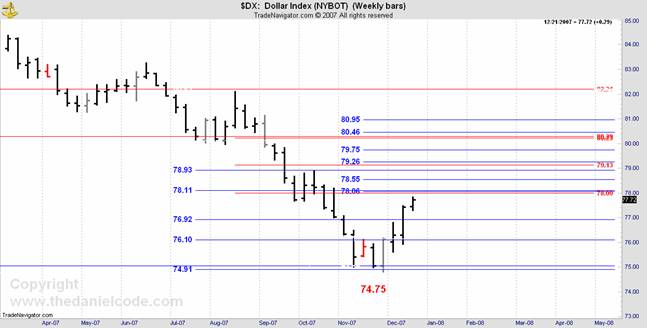
Having previously obliged by turning just 16 ticks from our DC number at the 26 November low this market made its high at 77.85 against the Daniel number at 78.00 for a variance from target of 15 ticks.
Friday's low was made 12 ticks below the next Daniel retracement at 75.43.
As the Danielcode defines all markets TDC (The Danielcode website) covers 14 forex crosses and 5 CME Currency contracts. Our charts are monthly, weekly, daily and on popular day trading crosses, 4 hourly.
We are never starved for action with this choice as important turns are being made on the monthly and weekly charts of interest to investors and hedgers, while daily and 4 hour charts go zipping up and down for day traders.
I really want to encourage traders to have a longer time frame. Jesse Livermore said "The money is made in the long pull"! Whilst weekly charts are hardly "long pull", the chart below posted on 31st December highlighted the turn near the Daniel number on the weekly chart and shows that you don't have to hunt for the top tick. The market was then at 1.14669.

In posted updatings we identified progressively lower targets until the trade ran off the chart on Friday to close at the next DC number at 1.0400

Precision continued during the week on EUR-GBP with this market scrupulously observing the Daniel sequence. We nailed both daily swings. I commented "The daily high is 74.84, the Daniel number is 74.84. HUH!! Did you guys see this?? How does he do it (Daniel I mean)?" The previous little top at 73.89 on Friday 28th was just 5 ticks from target.

New Zealand, lying just west of the International Date Line is one of the first countries to see in the New Year. Late on New Year's Eve as the partying began in earnest I sent an update to subscribers. My webmaster, a dashing young techie had long departed to one of the northern beach parties that nowadays are just a lingering ember in the mind of your contributor. Before you think him entirely mad recall that in the Southern Hemisphere it is midsummer. Our Christmas meal is usually Turkey and salad and our New Years are blurred images of ice cold beer and long white beaches.
As I worked into the night updating charts I saw a number of nice setups sufficient to influence me to email a PDF to my loyal subscribers rather than wait for said techie to recover from what I vaguely remembered was more likely to be a 3 day absence than an overnight affair. Having provided some very nice Christmas presents with the trades shown above and others you can see at TDC website under "Current Trading Report", I determined that New Years surprises were still welcome. How many of you saw these charts sent at 3:00AM US ET? This is what was setting up:
EUR-JPY Weekly

Daily
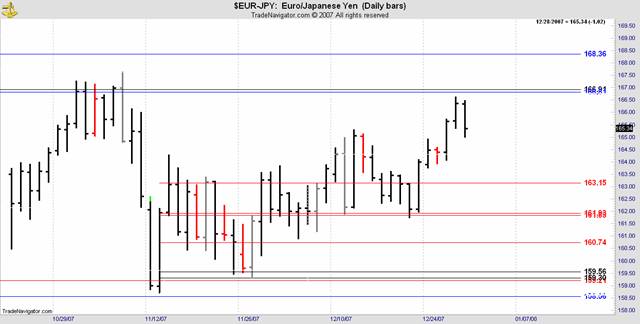
The weekly EUR-JPY was at a cluster of Daniel numbers. The daily chart had already made its turn just 15 ticks from the Daniel number at 166.81. If you partied away the night, this is what you missed as this market closed out the week just 9 ticks from the lower Daniel number. The move was worth about 500 ticks so if you missed it I hope the party was a beauty!!

Investors and Currency Hedgers The monthly chart of EUR-GBP is on a tear and has more to go. The mid blue lines were all created from the May 2000 low. The darker blue line at 72.20 being an intermediate high came from an intermediate low. The mid blue Daniel sequence has already given us two highs and three lows so we know this market is recognising the Daniel sequence. That gives us a high probability that the next top will also come at a number in this sequence.

A number of other crosses are at their monthly Danielcode targets. If a reversal signal is given, these will likely be important turns. Absent a reversal signal we assume the trend continues.
GBP-EUR Monthly

GBP-USD Monthly

Important turns are made at or close to the Daniel sequence numbers. Danielcode monthly charts are available for most forex pairs and CME currency contracts.
The Danielcode is not a trading systemalthough its eerie precision certainly suggests a number of systems that could be built around it. It is a unique system of sequential numbers that give us high probability turning points if the appropriate reversal signal is given. Absent a reversal at or very close to a DC number, we assume the trend in place continues, so you take reversal signals if they occur; otherwise you take continuation trades until a reversal occurs. A client put it this way:
"John, thanks and that is what attracted me to this- that it isn't a trading system but an accurate reference point. It is then given full discretion to trade accordingly." RD, Kansas City, MO.
If you would like to enable your clients to have access to some of these numbers I would be glad to hear from you.
Reversal signals are different on each time frame. A reversal on a daily chart may not be a reversal on a weekly chart. You will each have your own idea of what a reversal constitutes depending on the time frame you trade and the degree of aggressiveness in your trading.
The best advice if you are a new trader is "Watch and Learn". Put the nearest Daniel numbers on your chart and follow the price action.
The Danielcode is not a blackbox. It is a model of transparency and accountability. The Daniel number sequence for each market is posted days and weeks in advance. They are there for all members to see. Either the market turns at the target almost always within 30 ticks on a daily chart or it will go to a subsequent number.
It was a big holiday fortnight in forex markets. We had big ranges and great trades but not before the markets did what they always do and shake out the weak hands. If you had the Daniel numbers you saw the points where turns were probable and this gave you a degree of understanding.
You can get all the Daniel numbers at the Danielcode website.
© 2008& John Needham


