


Tumultuous Thursday
Thursday’s drama in US Equity markets, highlighted by the largest ever range day in the Dow which ran from 10879 to 9872 and half way back again for a record daily range of 1007 points, set hearts a-beating and scribes a-scribbling, and likely caused a universal malaise amongst margin clerks ranging from apoplexy to angina or worse, as the unexpected and unexplained struck with a degree of ferocity not seen since the worst days of the late lamented Bear market.
For futures traders and others of the 1-3 day trading ilk, it was a bonanza. A joyous sleigh ride of epic proportions as markets did what they always do. Surprise with the trend.
For those who didn’t know that the trend in Equities, well before last Thursday, was down, the experience, if survived was cathartic. For many it was terminal. And that’s how it should be. In our modern world where nothing is ever “my fault”, and where massive errors ranging from the insolvency of nations to the Fannie and Freddie and banking corporates debacle are all papered over, usually with the soliloquy “We’ll learn from this”; the knife sharp world of trading (in regulated futures markets at least) is swift, brutal and clean in its rewards and the costs to those who were in the wrong way.
 But, as always there are other interests, and for all there are lessons to be learned. Let’s start with what happened, and no, it wasn’t the proverbial fat finger. It was in fact the “PlayStation Syndrome”. Let me explain. This urban myth, is propagated by those who for no reason I can understand, seem personally affronted by the massive rally in US Equity markets, coming out of the March 2009 low. The argument is based on the assumption that fundamentals do not support this historic Equity rally, and that it is caused by excess government supplied liquidity to the banksters and their prop traders. The story goes that whole legions of young people are recruited with the only requirement being a facility with gadgets and lightning fast reflexes. These hordes then are employed trading stocks on momentum models with no understanding of value or valuations.
I have no idea whether this is true, but given that current accounting rules obfuscate anything approaching “true and fair” balance sheets for financial stocks, a lack of understanding of true stock values is likely not confined to this group.
The real meaning of this story like most of its apocryphal kin, likely has a germ of truth. And that truth, as with most nasties, happens not by accident but as an unintended consequence of government action. In this case the growth of alternate exchanges, encouraged by bureaucrats under the cover of promoting “innovation”, and a commensurate failure, once again, to understand the inherent correlation of apparently diverse markets. The Washington Post explains:
May 6 (Bloomberg) – The U.S. Securities and Exchange Commission and the Commodity Futures Trading Commission are reviewing “unusual trading” that contributed to a plunge in U.S. equity markets today.
The SEC and CFTC, in a joint statement, said they are “working closely” with other financial regulators and exchanges to examine why stocks fell. The agencies plan to make their findings public along with recommendations for appropriate action.
The Dow Jones Industrial Average plunged almost 1,000 points before trimming its drop and ended down 347.80 points, or 3.2 percent, at 10,520.32. About 0 billion of U.S. stock- market value was wiped out in less than 10 minutes, according to data compiled by Bloomberg.
“This is unacceptable,” Kanjorski, who leads a House Financial Services subcommittee that oversees the SEC, said in a statement. “We cannot allow a technological error to spook the markets and cause panic.”
Some price swings of stocks defied logic. The shares of Accenture, a consulting firm, fell from to a single penny and then back to again. Procter & Gamble traded at on the New York Stock Exchange. But at the same time, Nasdaq was reporting that the company's shares were selling for .
Thursday's dramatic gyrations added fuel to the biggest policy debate in Washington: how to regulate Wall Street. That billions of dollars in stock-market value could be wiped out so abruptly, with such a lack of certainty about the cause, is a reminder of the high stakes involved in a system that is little understood by average investors. The confusion also highlighted the evolution of stock trading, which some market officials say has happened too fast without adequate safeguards. The NYSE has "circuit breakers" in place to pause the trading of stocks during a panic. But investors also can trade stocks on 10 different electronic platforms that have sprung up in the shadows of the NYSE in recent years and generally have no way of stopping unrestrained selling.
Senior executives of the NYSE said the Securities and Exchange Commission has given too much freedom to its competitors, not ensuring that these smaller trading platforms have necessary protections.
Lou Pastina, the NYSE's executive vice president of operations, said the system set up by the SEC exacerbated problems on Thursday. When the sell-off started, the NYSE paused the electronic trading of several stocks and moved to traditional auctions of stocks with a person acting as a middleman. The goal was to stem the panic and find rational buyers. While these stocks were paused on the NYSE, sellers moved to other electronic exchanges such as Nasdaq and Instinet. So many sell orders came in at once that some stock prices listed on those platforms fell to near zero. Shortly after, trading of those stocks started up again on the NYSE at the paused prices, leading to wide disparity in prices among exchanges.
"How did this happen? You've got to ask the SEC," said Ted Weisberg, president of Seaport Securities and a trader for more than 40 years. "The bottom line is the government created a trading mechanism with a lot of different marketplaces. Now they probably have 40 or 50 different venues where stocks trade. I don't know what their rules are. The public doesn't understand.
This is another perfect example of the government changing the ground rules and we end up with unintended consequences."
 So the simple version is that there are two or more almost separate universes working in financial and particularly Equity markets. On NYSE we have stocks being traded, and a culture of analysis, valuations and a level of understanding of inherent values, together with a degree of human intervention from the market makers. On the other, wholly electronic exchanges, we find the dominance of the dreaded High Frequency Trading and Black Box programs where computers run “algos” and interrogate each other for price discovery. A discussion of the merits of these new innovations is beyond the scope of this article, but suffice to say that for these alternate players who in fact dominate market volume, numbers and momentum are all that counts. The machines care not about real worth, if there is such a thing. They are driven by correlations, derived or D2 Data, of which I have written about previously, and the all conquering mo-mo-mo-momentum.
Time and again we have seen major market events exacerbated by little understood computer behaviour. Thursday was another such day when something broke.
The Investors’ Take
For investors who survived the heart jolting price action of Thursday, not only in Equities but in most forex markets, take heart. Our proprietary 6 day trend chart remains on its Buy signal and although the week’s action has clearly created a conditional Sell signal, more downside work remains to be done before the Sell signal is confirmed. And you can be assured that the big battalions are on your side. Today we see the European equivalent of TARP being unveiled and markets are loving it. European Central Bank has hijacked the “Perfidious Albion” epithet from across the English Channel and gone where no German previously dared. To Quantitative Easing, the horrid practice of buying toxic debt from major banks to maintain some semblance of solvency whilst masking such insanities with an economist’s gloss of “policy”.
All of this together with a determined program of rhetoric and lolly, aimed squarely at “Death to the Shorts”, to paraphrase Ms Merkel (who just lost her Upper House majority over funding the Greek bailout), will give this kitty a great big bounce. Perhaps enough to restore our somnolent Bull. But certainly enough to shake off complacency. It may be a dead kitty bounce, but personally I doubt it. If the Europeans can actually deliver on their ambitious plans, there will be plenty of wallpaper to cover the cracks. At least until the next time.
And as usual, you fine hearted folks from the US of A are front and centre in the effort, through your unwavering support of the lofty and growing ambitions of the IMF who have undertaken to pony up 50% of whatever contributions to the cause the EU actually makes (US provides 17% of IMF funding). Personally, I would have thought that there were much more important tasks for your money, but obviously the Dollars are without limit as Mr Bernanke has again opened the US Dollar funding program to European Central Banks. What a guy!
The Traders’ Take
Our Major Market Update will usually appear in Financial Sense on Wednesdays to fit into the flow pattern, but in view of the amazing trading opportunities offered by a bountiful and felicitous market last week, they are incorporated here. Somehow the drama of great market moves languishes quickly with the effluxion of time. So here in all its glory is how Danielcode traders saw last week’s major market action:
S&P
On 6 Day Regression Channel, trend is: UP, with an obvious conditional Sell signal apparent
On 12 Day Regression Channel, Trend is: UP
On 24 Day Regression Channel, Trend is: UP
The DC 59 week time cycle expiring 04/22 has certainly struck with a vengeance this week. That date has been on these charts, published free for all, since the 04/16 post, so you had plenty of warning of a likely market turn. The closing high from the daily chart came on 04/23. Not bad for a longer term chart. Our protocols call for a sell signal which we have right now, to be confirmed by a close below the low in order to confirm the signal, so it will be a while before the trend change verdict is in on this chart.

I want to take you through the shorter term charts that were signalling Thursday’s sell off (but not the quantum) so that you can see that far from being a surprise, this market has been signalling a pullback for quite a long period.
The next chart is the 2 day chart which as a subset of our base DC “weekly” chart of 6 trading days, gives us an earlier insight into likely market moves. Note that Thursday’s “flash crash” went exactly to the 3rd channel of our standard deviation model. What shocked the market was that the selloff didn’t even acknowledge the 2nd channel as it usually does.

But it did later in the day, by closing above that number on Thursday and holding it on Friday. Note that the RG channel changes subtly as the bar methodology changes. Both are valid and the “close only” chart often offers insights not afforded by our bar high/low charts.
This is the “close only” version of the 2 day DC Channel chart:
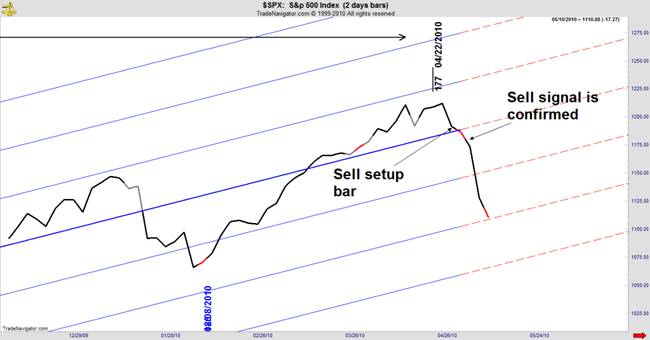
Our next chart takes us down to the daily chart of the S&P index and highlights the sequence of DC Trade Signals posted every day for members that led to Thursday’s bonanza for Danielcode traders.
You can see that the first Sell signal came the day after the top; the small counter trend rally was signalled and the reversion to the Sell signal came on just the perfect day. If you followed these signals or merely observed the DC 59 week time cycle expiring on 04/22, you may have been surprised by the quantum of Thursday’s move, as most of us were. BUT not the direction. Shorter term traders who were long going into 05/04 and after, simply don’t know how to read market signals. Danielcode members profited handsomely.

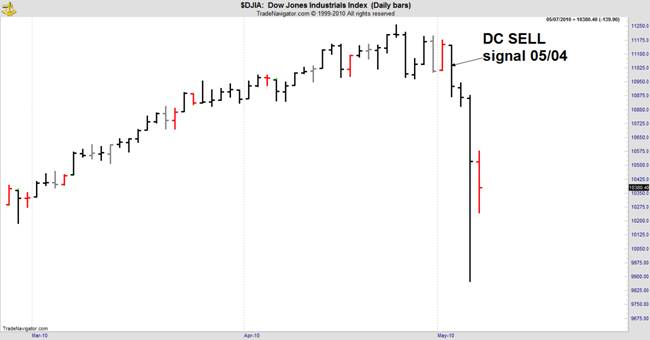
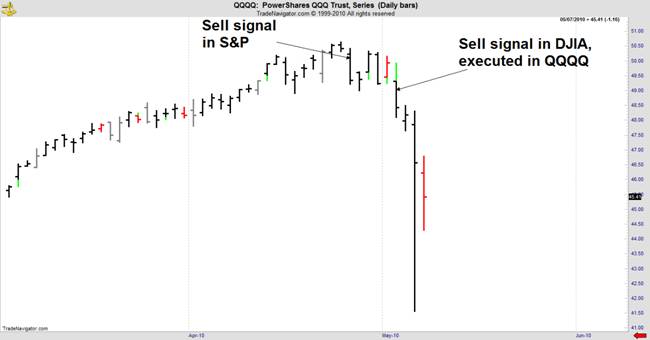
For those not familiar with DC trade protocols, the highly correlated nature of US Equity markets and Germany’s DAX, means that DC Trade signals in any of these Equity markets can be executed in any other of them. Other correlated markets are shown below.
First the Dow:
Then the NASDAQ tracking stock the QQQQ:
And Germany’s DAX index. This is the futures contract:

So what we can say with a degree of certainty is that short term traders saw the top and had multiple opportunities to get short or at least to stand aside. Those still stubbornly long these markets on 05/04 and after, didn’t know the markets’ code and made the trade for those on the right side. Put at the top of your list that if there is to be a surprise, it will be with the trend. Knowing the trend is passé but vital. The Danielcode knew.
Now, to put this fast move into perspective, let’s take a step back and look at a longer term view:

S&P has pulled back to the 3rd iteration of the Danielcode retracements, that is 44% of the penultimate swing, and has not even started to correct the major swing so far. That keeps this market in a strong position, but only price action, and future DC trade signals will show us the path going forward.
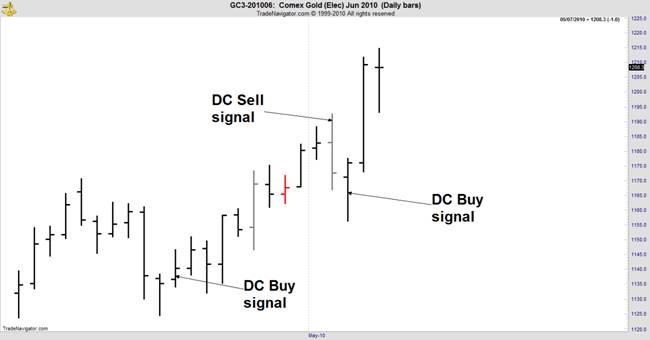
Gold
On 6 Day Regression Channel, trend is: UP
On 12 Day Regression Channel, Trend is: UP
On 24 Day Regression Channel, Trend is: UP

Here’s the Daily chart with posted DC signals for those who like to trade both ways:
US Dollar Index (DX)
On 6 Day Regression Channel, trend is: UP.
On 12 Day Regression Channel, Trend is: UP
On 24 Day Regression Channel, Trend is: DOWN.
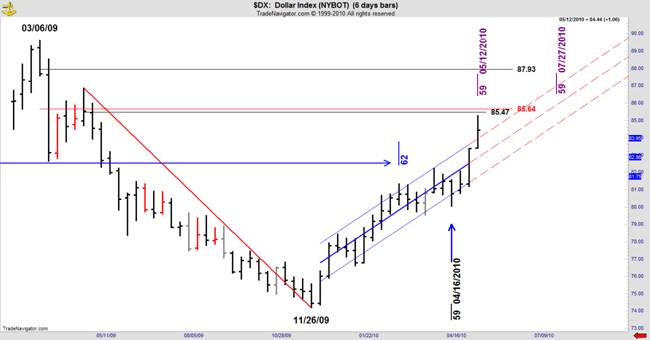
DX is trading above its regression channel; is at a DC time cycle and has been challenging the DC Black line number for the penultimate swing (marked in red). All of these factors provide resistance.
Here’s the latest DC T.03 Trade Signals from the Daily chart, including DX stopping on Thursday just 1 tick from the DC Blue line target.

Oil
On 6 Day Regression Channel, trend is: UP, but will likely set up a conditional Sell signal on Monday. From last week’s LTTC update: “The 6 day chart is at overhead resistance from the median of the Regression Channel.”
On 12 Day Regression Channel, Trend is: UP.
On 24 Day Regression Channel, Trend is: UP

Oil started selling off on Monday in response to the DC Sell signal posted for members on Sunday night before the open on 05/03. This is the daily chart:

US T Bonds
On 6 Day Regression Channel, trend is: UP
On 12 Day Regression Channel, Trend is: DOWN. The 12 day chart has created a conditional BUY signal. A close on 05/21 above 121^14 will confirm.
On 24 Day Regression Channel, Trend is: DOWN

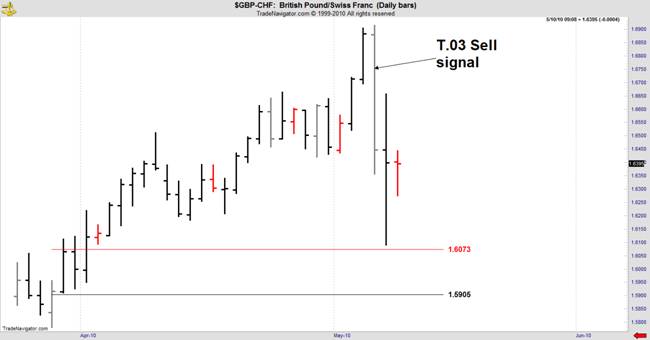
In addition to our major market trades, we had a handful of really nice Forex trades. This was a beauty:
The regression channels used in this article are posted free for all at www.thedanielcode.com . I hope they are of use to you.
The coming week will be a story of volatility. Greece, the European periphery, fall and rise of the Euro, safe haven assets, US Primaries and UK’s hung Parliament. There is drama a-plenty and the VIX index has exploded from its long sleep. This portends more fun and games for nimble traders who long for volatility. But acid reflux for long term investors.
Remember that the major sources of potential wealth for the great unwashed, are housing and stock markets. The American dream. With mid terms charging down the turnpike, at least one of these must offer a story of recovery and hope. You can safely bet that the vast apparatus of State on both sides of the Atlantic is a Bull. Soon we will see if the spin machine can continue to mask the awful improvidence of US, European and UK Banks.
Our final chart today is something of a gem for those who stuck the course and got here. In the “Master Class” articles for this august publication, I explained the proper method of counting market “Time”, and I introduced you to the dominance of the 59 DC “week” cycle in the S&P. That time count gave us the 2007 high and allowed the Danielcode to call the 2009 low to the day and a few ticks. And now the DC 59 time cycle has struck again. The closing high was made at 1208 just 2 points from the DC retracement. Sharp eyed readers will see that the April top came at the 59.3 DC price retracement of a major swing. So we have “Time” and “Price” both using the same DC vibration. But on different chart axis.
This is Gann’s long thought extinct “time and price squared”. It lives and breathes after all!

I hope you have enjoyed seeing how rational and orderly markets really are. That’s what makes them occasionally predictable. If you would like to know more about Danielcode analysis and trading there are videos, webinars and much else at the website. I invite you to join us.
John 14:6 Jesus saith unto him, I am the way, the truth, and the life: no man cometh unto the Father, but by me.
Copyright © 2010 John Needham


