


There is an entire industry, presumably of bullion holders, dedicated to the bullish case for Gold. Articles espousing the supposed benefits of owning physical Gold or at least being perpetually long Gold are pumped out with rare dedication and single mindedness.
Indeed there is an unhealthy PC element to this ongoing campaign to lure you into the perma bull camp, but a fool and their money are soon parted and what we can say about the perma bulls of Gold campaign is that they have been consistently wrong since 17th March 2008. Since the Danielcode warned that “markets fluctuate, sometimes violently” in late February in these pages and forecast at least an interim top in Gold at 1034.10 (I know, I missed it by 2 ticks. Shucks), we have consistently kept our clients on the right side of the gold trade with both long and short term signals.
You must be absolutely clear that comments, views and pontifications in publications such as Financial Sense represent a vast spectrum of views and opinions, some better thought out than others, but all sincere and with Gold at least, heartfelt. Financial Sense, better than others has the most catholic of tastes and you can certainly get both sides of the story here, a condition that does not apply to the dedicated Gold sites where orthodoxy is all and GATA is enshrined.
For many of our readers these pages constitute both background knowledge, vital insights and entertainment. In the latter category, I can no longer resist the temptation to poke fun at my fellow scribblers over two delicious incidents of late.
 The first was the much promoted story that on the perma bulls’ analysis, Comex would be unable to deliver the requisite quantities of Gold to settle the December contract which has now gone off the boards. I opined to my members that this was a hoary old story, best ignored, although I did wrap my comments in some Australian vernacular. This week produced further mirth with the story now morphing from “Comex will be unable to settle the December contract”, the original basis of this much repeated melodrama to: “Comex will be unable to settle some contract some time in the future, but we don’t know when that will be!”
The second story along the same lines, but even more dramatic was headed “Armageddon” and ostensibly argued that due to a backwardation in the learned author’s proprietary measure of Gold demand, including futures prices in Comex Gold, demand for Gold had reached levels at which the futures market could no longer operate and the backwardation to which he referred meant that sellers of Gold were signaling that they would not sell Gold at any price.
Now, backwardation in the general sense means that the far or next sequence month in the futures contract is selling at a discount to the front or current trading contract.. Contango is the expression used for a normal commodity market where the future or far month trades at a premium to the front month contract. I read the article first with amazement and next with amusement and have been waiting patiently for someone to state the obvious, that backwardation per se, implies the exact opposite of the author’s case, that is, backwardation in futures contracts implies weaker demand going forward.
This particular article found great favour with many of the Gold sites as well as the more excitable accumulator sites, but guys, I have to tell you, that whilst it was certainly sensational it is just plain wrong! Gold sellers continue to seek the best prices they can get. The idea that a 3 day backwardation in Gold signals the end of Gold trading on organised and casual markets is fanciful at best.
Contangos and backwardations are of great interest to longer term traders and investors. This story from Fortune Magazine of 12/05 shows how traders are affected by significant price differentials:
NEW YORK (Fortune) -- With oil now at a barrel, you no longer hear Congress complaining about oil speculators. The irony is there's probably more real speculation going on today than there ever was back in June and July.
What's different now is the structure of the futures market, which is giving big investors an incentive to buy and hold huge sums of crude. Specifically, the November 2009 price of oil is considerably higher ( a barrel higher, to be precise) than the spot price - a scenario futures traders call a "contango" market. (The opposite scenario - spot prices higher than futures prices - is known as "backwardation.")
"The steepening of the contango has opened up carry-trade arbitrage opportunities that are slow to be closed due to constrained credit conditions," Goldman Sachs wrote in a recent research report. Translation: this is a great time for investors to be hoarding oil. Today's market is giving Goldman clients and other well-heeled investors an opportunity to buy oil in the spot market for a barrel, sell it forward in the futures market for , and then pocket the -a-barrel difference, less storage costs.
Unlike futures flippers, contango traders really do impact oil prices, yet they're getting a free pass. According to the U.S. Energy Information Agency, domestic oil inventories have risen 9% since oil prices peaked in early July. While some of that is attributable to the weak economy and slack energy demand, gasoline consumption declined only 5% over the same period and gasoline inventories have risen only 4%. (If you're wondering why contango traders would target crude oil but not gasoline, vaporization issues make gasoline harder to store.)
Demand for oil storage is so keen today that some big investors who can't secure storage on land have resorted to leasing supertankers and using them as floating oil tanks. For example, the U.S. oil trading firm Koch Supply & Trading recently leased the 2-million-barrel-capacity Dubai Titan, a Koch spokesperson confirms, the third supertanker Koch has leased this year.
To make the case for higher Gold prices, we need to see sellers demanding higher prices in the forward month’s contracts, not lower. The argument then turns to the bullion holders continual lament that the paper prices of Gold, and specifically the Comex Gold futures market is rigged, doomed to failure and no doubt infected with an unspeakable disease as well!
To all of which I say that Comex as a division of NYMEX has for many years been the world's largest physical commodity futures exchange. On August 22, 2008, NYMEX Holdings was formally acquired by CME Group (symbol: CME) and the NMX symbol was de-listed. The present turmoil in financial and in particular in credit markets is almost entirely attributable to the offending instruments which destroyed many great businesses, being off market, not open to compelling and challengeable valuation and not subject to the rigor of market price discovery.
Every trade on the NYMEX Exchange has the NYMEX clearinghouse as counterparty. The National Futures Association (NFA), under the supervision of the Commodity Futures Trading Commission (CFTC) approves and registers almost all market participants. More importantly still, all positions on NYMEX are marked-to-market each day against margins that are required to be posted and held by clearing members. The CME is the largest futures market in the world. They long ago perfected the art of risk management and broader markets would all benefit by a daily mark-to-market policy. Indeed the cause célèbre of investment and shadow bank failures, not to mention government jack up jobs for banks from US, Iceland, UK, Europe to the lands Down Under is off balance sheet and so called level 3 or assets incapable of simple, verifiable market valuation. That is not a problem in Comex Gold.
So if any of you seriously believe that the Chicago Mercantile Exchange is running a futures trading market where real price discovery is NOT happening, or where default on a CME traded futures contract is imminent I suggest that you advise the CFTC forthwith or contact the CME Chairman Terrence A Duffy or any other CME director. They are all listed at the CME website. The ancillary arguments that the Exchange can in certain conditions settle its contracts in cash rather than physical Gold are a red herring. The settlement rules are published and are a prerequisite of trading. If you play this game you know beforehand what the rules are.

Absent this action, we can take these doomsayers as a bit of fun and entertainment, but whatever else, I urge you not to take it seriously. The Gold cult remains moon struck and are howling at the lunar orb!
For those who think that I am grinding the opposite axe to the perma bulls, I am not. As traders, we are rarely bullish or bearish. We just trade the signals in front of us. We are as willing buyers as we are sellers, as you will see in the trade signals a bit later. We are also observing different time frames which accounts for just part of the absence of a meeting of the minds. Investing in asset classes is an entirely different discipline to trading.
In the investing ranks, the base is a strategy that identifies fundamentals in various asset classes and purchases and holds those assets over a relatively long time horizon. In long term bull markets, such actions become an act of faith. Only when they are tested by infrequent bear markets is the fallacy of these arguments revealed. Here is the long term S&P chart:
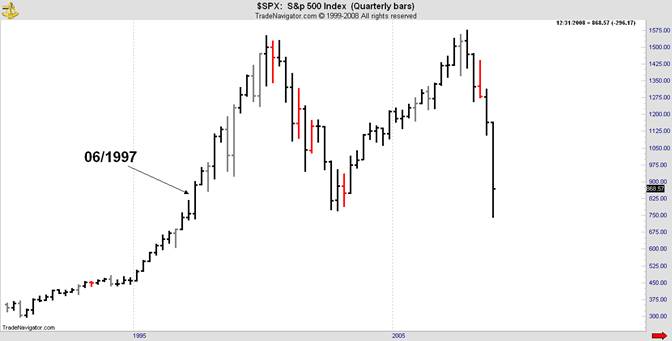
Any “buy and hold” strategy initiated after June 1997 is presently underwater. The next chart is Japan’s Nikkei index which foretells the course that Paulson and Bernanke are following for US and hence the world. Near zero interest rates and floods of forced liquidity along with a refusal to allow markets to cleanse the system of overpriced mortgage loans, leveraged loans and soon commercial property loans, are the hallmarks of “Quantitative Easing”. the Bank of Japan’s formula, post their property bubble, which is now being aped by the US Fed. For Japan’s investors the “lost decade” has spanned 20 years so far.
Japan’s ZIRP or near zero interest rate policy is responsible for the ubiquitous carry trade that allowed much of the leverage into level 3 assets and a fair percentage of the super liquidity we saw earlier this year in commodity markets. The Nikkei picture is precisely what is happening in global markets now.; asset liquidation, denied by government forces who profess market discipline in the good times, but refuse and obstruct that discipline when the corrective cycle that always follows excess, begins to growl.
Consequences of failed policies be they governments, institutions or investors can be delayed, obscured or for the fortunate, chosen few, transferred to others, with the public purse being the current favourite. But as the Nikkei shows us, they cannot be denied. I suggest that you spend some time thinking about the Nikkei chart. With today’s FOMC meeting leading the charge to ZIRP, that witches’ brew of economists and commentators are sanguine about quantitative easing as the next arrow in the Fed’s quiver. Be doubly careful what you wish for from these folks. Their record is about as good as the Gold bulls in 2008.

Talking Gold; Trading Gold
For many, tales of “Armageddon” and “Red Alerts” are what they crave. For some it is the visceral fear of the unknown or better still, inherent disaster that stimulates the senses like a Stephen King novel. Newspaper editors have long known that others’ misfortune is irresistible honey to the great unwashed. These types of stories are a sure fire publicity generator.
For those in the serious business of making money from trading Gold, these stories and “the end cometh someday but we know not when,” are bias inducing distractions. My preference is to read them and have a laugh or for the more serious versions, file them away as a future possibility. The danger is to allow them to induce trade selection bias and for traders that is an egregious error.
For traders, the strategy window shrinks exponentially, especially for futures traders. Those trading leveraged markets know the criteria for entry comes down to time and price, the trader’s constant ruler. Even for perma bulls you need to know where and at what time to buy, otherwise you are putting your head into the noose. The Danielcode not only provides the number sequence where all markets will turn, but through it’s proprietary T.03 “time” turn signals, we issue daily alerts to our members on highly probable market direction. Some of these signals are in direct markets and some are in highly correlated markets or D2 data, of which I have written previously. All require price action to validate the signal and pull us into the trade. How this process is effected is shown in the T.03 and other videos available free at the Danielcode website. Even monthly signals start with a turn on the daily charts.
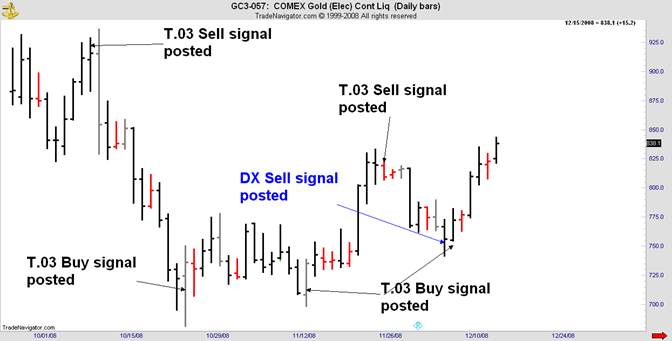
To illustrate the benefits of tying some rigor to your Gold trading or investment strategy, here is the Comex Gold continuous contract covering this market from the October highs and lows. What I am showing you here are the benefits of an unbiased trading strategy taking just the Danielcode T.03 trading signals which are posted daily for members, usually about 2 hours after the RTH close of US markets.
You will note that of the last 5 Danielcode trade signals issued by the T.03 indicator, 3 were buy signals and 2 were sell signals. There were ancillary D2 or derived data signals in correlated and anti markets that traders could also have used, but these are the total of T.03 Gold trade signals issued and elected since early October.

The 2 Sell signals made about 7 which in Comex Gold is worth ,750 per one contract, and on the same basis the Buy signals made 6 or ,600 per Comex Gold contract. That’s what Danielcode traders do. There is no selection bias. We just take the trades as they appear. From entry to exit is a matter of trade discipline and some basic protocols. Nothing in the trade signals tells us whether each particular trade will be a monster or a minnow.
The Gold “Anti” Trade
Better still, for Gold traders there is also the US Dollar index to trade which is the Gold “anti” trade. You know from my previous columns that DX down means Gold up and vice versa so Gold traders get a double serve as DX trades marvelously on the inverse of the T.03 Gold signals but has some special tricks of its own that our trade signals identify. Below we “mix ‘n match” the T.03 signals in DX and Gold to show how these “anti” signals work together to define our trade signals. The 2 sell signals on the DX chart captured about ,000 per one DX contract and the long trade signaled by the D2 sell signal in Gold captured about 00 on the same basis.
Obviously in highly correlated markets including inverse correlation, risk management is paramount because they are essentially all the same trade, but it is the asymmetry of these markets which make the dual trade so delicious. In previous moves of late we have seen Gold doing the heavy lifting for our P&L. In the latest trade we have an extreme move in DX. That’s the fun, guys!

The argument here is that even long term monthly signals are obliged to start with a turn on the daily charts, and that’s what the Danielcode number sequence shows traders; the likely turning points in all markets. By adding the proprietary “time” feature in the T.03 time turn signals, we focus on high probability market turns.
I have written previously of WD Gann’s teaching that “when time and price are squared a turn will result.” An interesting and observable feature of the “time and price” inherent in the T.03 signals, which I hasten to say is not based on Gann’s methodology but merely fits into the generic mix of “time and price” signals, is that when a signal is not elected (for the concept of “election” please see the free trading videos at the Danielcode website, www.thedanielcode.com), we often see an acceleration of the trend in force.
Simply put the market cycles set up certain well defined and high probability turning points which the T.03 signals identify in advance. We always require price action to “elect” or pull us into the trade and to show that markets are recognising the price levels that we have identified as likely turning points. When markets ignore these pre-measured cycles, it means that a new force has entered the market and the accelerations from unelected T.03 signals are providing interesting trade opportunities with the increased volatility which traders are presently blessed with. Here is a recent example in DX:

Many hold that a failed buy signal is a sell signal and vice versa. I hasten to point out that on Danielcode derived signals at least, this proposition is not supported on backtesting, but given current volatility and extended trading ranges it is an observation worth noting.
Interestingly, I am told that the Red Flag Alert article published in Financial Sense and elsewhere which I gently jested about earlier, was first published on 12/05, the day of the most recent swing low in Comex Gold and coincided with the latest T.03 Buy signal in Gold posted before the US open on Monday 12/08. If we now update the Gold chart with the DX anti signals we see that the T.03 Sell in DX (anti gives Buy in Gold) was made for Friday 12/05. And that means that it was posted for DC members at about 7PM US ET on Thursday 12/04, that is about 96 hours before Gold started its latest rally.
So we see again not only the Gold/DX nexus that is apparent in these charts but a subtle reinforcement that DX drives the Gold market to a significant degree.
What of DX? This is the first significant pullback since the March lows morphed into a high intensity trend in July. We certainly have an overbalancing of price and are close to an overbalancing of time. So, is the DX rally over? Quite possibility, although we have higher targets that are a stronger probability.
If so, how US Dollar weakness will play out for China and other US creditors, holding and presumably expected to keep buying US debt as record issuance approaches, is a story for another day, but I imagine that is a problem high on the list of policy makers. At the very least it is hard to imagine a fiscal scenario more adverse for the Dollar and helpful to Gold. For Gold bulls it really is a question of “If not now, then when?”
Friday is triple (now quadruple) witching, so the twists and turns, revelations and bailouts will continue to enthrall market traders and observers as another year staggers to its close. For some 2008 has been brutal. For traders it has been a rare gift.

For perma bulls in Gold, of which there are many, there is nothing in these trading techniques that should concern or threaten you. On the contrary, all of these techniques are easily adaptable to your own trading or investment strategy. If you are in the “Gold is going to 00” camp and want to know when to buy or add to your stores of bullion, one balanced approach is to take only well qualified buy signals in Gold or HUI. Properly framed signals will also identify with precision where the trade will fail and that’s where your stop, or loss mitigation plan fits in. You can see from the charts in this article that though we do not pretend to get every signal (some are made on minor time frames that I don’t cover), almost all are made at Daniel price sequence levels so this form of methodical approach will greatly enhance your chances of an appropriate and therefore profitable entry and asset acquisition.
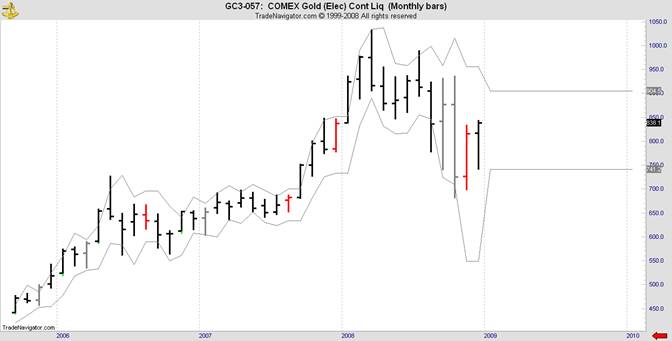
On the monthly binomial chart, Gold is close to issuing its first Buy signal since March and HUI is even further advanced in a potential monthly Buy signal. Gold bulls are stirring with a sense that their time is coming again. Whether this optimism is validated, is ultimately in the hands of the US Dollar Index.
Whatever the future adventures of Gold may hold, you can be absolutely sure that despite protestations to the contrary, there will always be plenty of Gold sellers at the best price available!
To all of the Financial Sense family, I bid you the compliments of the season as Christmas approaches, and invite you to visit the Danielcode website where there are articles, model accounts and trading videos, for all who seek knowledge.
Pro 1:7 The fear of the LORD is the beginning of knowledge: but fools despise wisdom and instruction.
Copyright © 2008 John Needham


