


It’s easy to be a pessimist after 6 years of an economic recovery where the majority are still trying to recover from the 2008 recession. Net job creation and wage growth since 2008 have been historically weak. However, we remain more upbeat as auto sales continue to push toward record levels, job creation since the labor market low in 2010 has expanded at a strong pace and asset values have provided huge returns. Mergers and Acquisitions are 50% ahead of 2014 at this point and closing in on the record pace of 2007.
By the end of 2015 our bet continues to be that 2015 will be seen as a stronger year for the economy and a struggle for stock values.
Stock values: With Price to Earnings ratios (P/E) at elevated levels along with record stock prices, there is a medium term hurdle that has not been fully discounted: Rising interest rates! Rising rates tend to shrink P/E multiples, thus requiring greater corporate earnings growth rates to compensate.

Thus far the past 8 months have seen earnings fall further than anytime since the last recession, while stock prices have edged higher creating a significant negative divergence as seen on the chart above. With interest rates clearly in an uptrend based upon a strong jobs market and anticipation of a secular trend in Central Bank induced rate hikes, it will be a struggle for stock prices to move significantly higher without a very big rebound in earnings.

Leading economic indicators (LEI) have maintained a solid support for the economy for 5 years until 2015. This LEI break below our 1990’s model growth zone of strength, like the earnings chart, is a problem. It can’t stay here long without trouble brewing. We are encouraged that the European LEI is quite strong and should help pull ours back up soon.

Earnings may rebound soon. Labor markets and pent up demand may lead the way. For the 2nd year in a row the US GDP contracted in the 1st quarter; not something you expect to see after 6 years of massive monetary stimulus and still waiting for a full GDP recovery. Using rising employment costs as a sign of a healthy jobs market it appears that costs and wages are rising recently as the demand for more workers continues to grow.

The most problematic age demographic are male workers in their 20’s who have the highest unemployment numbers at over 12%, but falling rapidly. Official unemployment is only 5.5% and that drops quickly to 2 or 3% for older workers and college educated. The circles below shows past periods when this hardest to employ group reached optimal levels of 10 to 13% unemployed. We are just now entering such a period which should bode well for wages and consumer spending should it continue.

We can argue that many new jobs are entry level, which has kept wages in a slow growth mode, but we must assume that Job Openings at 15 year record highs will lead to increased hiring and wage acceleration. In 15 years we have never seen job openings above the rate of those being hired.
[See Also: Making Sense of the Latest Unemployment Data]

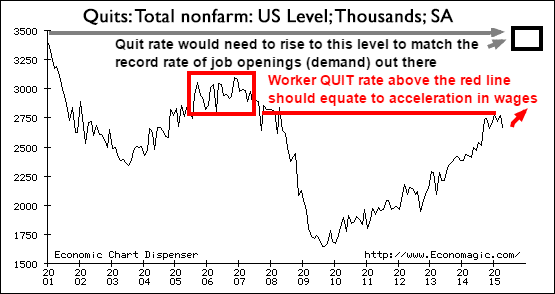
Quit Rates: One telltale sign of higher wage growth rates will be higher quit rates as we have pointed out many times. It’s rising and testing levels that imply that employers are willing to pay above market income to retain their workers. Quits accelerated in 2014 which reflected a faster wage growth. Even stronger wage inflation should reach our headlines upon the next upturn in Quits!
The point of the many Job related charts above is to highlight the fact that consumption and income are rising and the trends appear to show faster growth ahead that should translate into a stronger economy and manufacturing. The tiny blip higher in US manufacturing (Purchasing Managers Index – PMI) may be only that. However, with European PMI’s looking better and our stronger labor market reaching a breakout stage, we are inclined to continue to look at this current period as aligned with our proxy of the 1990’s US economic expansion as shown here using PMI data.

The first set of numbers 1 through 6 above marked the pattern of manufacturing ebbs and flows during the booming 1990’s. The time spent in expansion territory (>50) has been even better in the this modest expansion and if it is correctly aligned then this chart implies we may have one more growth phase directly ahead. Perhaps a couple years of expansion are ahead of us even though confirmation thus far has remain elusive.
Related podcast interview:
Kurt Kallaus: Bull Market Likely to Run Another 2-3 Years


