


Global turmoil has taken its toll on stock prices over the past six months. A number of factors, including the sharp plummet in oil and commodity prices, an arduously strong dollar, weak global demand and worries about the growth trajectories of various economies, have coalesced to shave roughly 20% off global equity prices.
The pain that started in overseas markets quickly made its way into US markets, and this is stirring up talk of recession—either that one is approaching, or that we’re already in one. Recession talk arises anytime the stock market swoons, as the implicit assumption is that stock prices are discounting a broad slowdown in the economy.
Jim Grant, of Grant’s Interest Rate Observer, said on CNBC last week that he believes the US is already in a recession. Others, including myself, disagree, but acknowledge that one could arise if conditions deteriorate far enough.
See: Lakshman on US Slowdown, Shocks, and China
What’s interesting about the way this is all playing out is that the focus has become international in nature, and small but important aspects, such as the residual health of the US consumer, are being forgotten about.
Paul Ashworth, chief economist at Capital Economics, put it like this, “The markets may have decided that the US is headed for recession, but obviously no one told US consumers.”
As far as the US economy is concerned, consumers are the driving force, and so far consumer health has done nothing but improve. Unfortunately, that can’t be said about other segments of our economy.
In this article we’re going to drill down into various components of the US economy and take a look at how each of those segments is performing.
To get us started, consider the following breakdown of US gross domestic product. The chart below highlights the four components of GDP: Consumer Spending (blue), Government Spending (green), Investment Spending (aka. business spending, yellow) and Net Exports (no color).
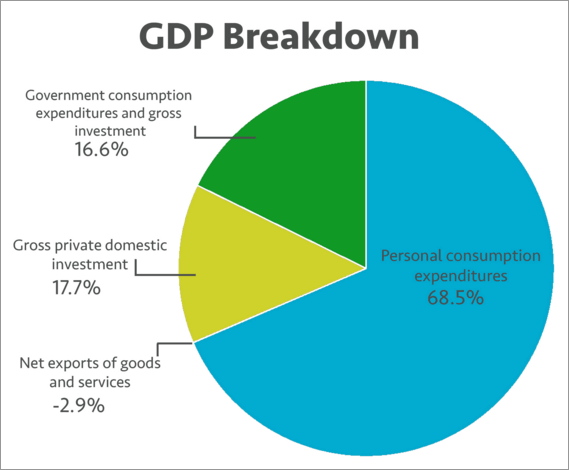
The purpose of this chart is to demonstrate the relative size of each segment of our economy. As we examine each component you can use this chart to understand how important, in terms of overall size, each segment’s performance is with regard to the overall economy.
Let’s begin with Government Spending and move our way counterclockwise around the chart.
The chart below shows Real Government Consumption Expenditures and Gross Investment, representing the green section in the pie chart above.

Notice that after declining from 2010 – early 2014, government spending is rising modestly again and contributing positively to GDP.
Next, let’s look at Gross Private Domestic Investment (yellow section of pie chart). This has been the primary area of concern, as it is where all the cutbacks in investment that occur as a result of collapsing commodity prices show up.

A couple of things to point out here: First, notice that private investment is a leading indicator, as it turns down well ahead of approaching recessions. Those who are calling for a US recession are focusing their observations here, suggesting that business spending will continue to dry up as commodity prices remain suppressed and the global economy slows.
I hate to say it but I have to agree that the outlook for private investment is deteriorating. While the growth rate of private investment, on a year-over-year basis, is still positive (as seen in the chart above), there is another perspective we can look at that is a bit more ominous.
This next chart also shows private investment, but it does so in dollar terms. Here we can see that private investment is beginning to decline on a quarterly basis. This situation occurred a few times during the last bull market, implying that it is not a death sentence to an economy or markets; however things are a bit more perilous now than they were earlier in this expansion.
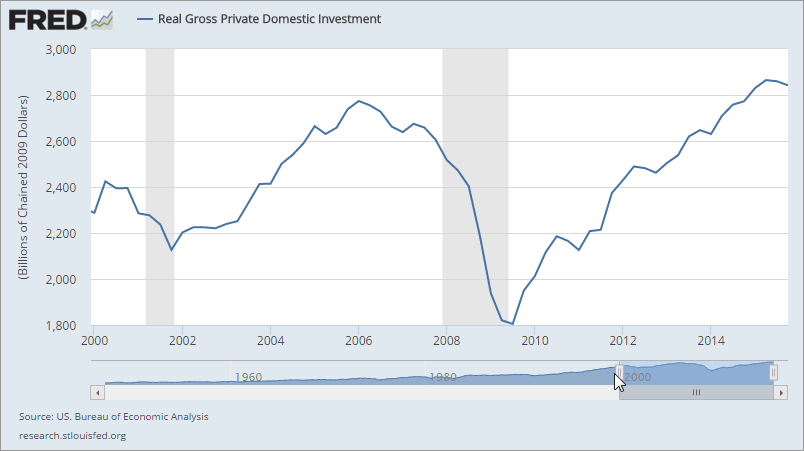
Two sectors of our economy, materials and energy, are seeing investment fall precipitously, as there is no incentive to invest in production when commodity prices are so low. It’s going to take a recovery in commodity prices to spur these sectors of the economy back into action, and as of now, that does not look likely in the short to medium term.
Next, let’s briefly look at Net Exports before moving on to the main driver of our economy, consumer spending.
You may have noticed in the pie chart at the top of this article that net exports actually detract from GDP rather than add to it (-2.9%). This is because the US currently imports more than it exports.
Here is what the Net Exports component of our economy currently looks like. After holding somewhat steady from 2010 to 2014, the end of 2014 saw net exports react negatively to developments in currency markets.

Late 2014 is when the dollar began its dramatic ascent, and this corresponds to the decline in net exports that we’re seeing. Put simply, the strong dollar is causing exports to decline and imports to rise, resulting in net exports declining further into negative territory.
Net exports shaved 0.47 percentage points off of Q4 GDP growth, which came in at 0.7%. With the dollar likely to remain buoyed by central bank easing around the world, net exports could stabilize here or move marginally lower.
Finally, let’s take a look at consumer spending, which represents the bulk (two-thirds) of the US economy.
The chart below shows the annual growth rate in Real Personal Consumption Expenditures (economic speak for consumer spending). This engine of economic growth continues to chug along well, with the most recent data showing consumer spending rising 2.6% over the last year.

This suggests that US consumers are doing fine, and their propensity to spend has not collapsed. If consumer spending remains strong, it has the possibility of keeping our economy out of recession.
While we’re on the topic, I think it’s important to point out that the “consumer spending” bucket includes a few items that you may not be aware of. Consumer spending includes not just direct purchases by consumers, but also money spent on behalf of consumers.
The biggest example of this is healthcare. Even though many of us remit a copay when we see the doctor, the full cost of that service is included in consumer spending figures, regardless of whether it’s paid by a company (insurance provider) or the government. Therefore, consumer spending is more a measure of consumption rather than “spending.”
To recap, the US stock market selloff has created a lot of buzz about whether the US is heading into recession. If we take a look at the component parts of the economy, we see that Government spending and Consumer spending (which collectively make up 85 percent of the economy) are doing just fine, growing at an annualized rate of 0.67% and 2.15% respectively, as of Q4 2015.
Read: Neil Dutta on Why He Doesn't Think We'll See a Recession Until 2017 or Later
The problematic areas of the economy include private investment, and to a lesser extent net exports. These two items represent roughly 15 percent of the economy, but also (at least in the case of private investment) tend to presage broader downturns in the economy. Private investment is up 2.5% from a year ago, but has turned down in recent quarters. Specifically, last quarter private investment declined at a 2.45% annualized rate.
The declines in both private investment and net exports are likely to continue as currency and commodity price dynamics appear unlikely to reverse course anytime soon. The ultimate question is whether the weakness here will be great enough to overpower the resilience seen in consumer spending.
So what’s an investor to do?
This is one of those circumstances where the market is discounting a recession, but an actual US recession is not imminent and may not appear.
However, that really doesn’t matter. The crux of the issue right now is that with oil and commodity prices as multi-year lows, and the dollar near multi-year highs, there is too much uncertainty as to how this will all play out.
Oil exporting countries are having to undertake extraordinary measures to protect their economies, including mass liquidation by sovereign wealth funds. Commodity producers are curtailing investment and trying to remain solvent. Overseas companies who have borrowed in dollar terms are struggling to remain afloat. All of these issues will take time to play out, and the market is likely to remain treacherous as they work their way through the system.
From my perspective, we’re going to need to see a sustained move higher in oil and commodities prices before uncertainty dissipates far enough for the primary trend to resume its ascent. Until then, it’s watch and wait.
The preceding content was an excerpt from Dow Theory Letters. To receive their daily updates and research, click here to subscribe.


