


If you’re one of our weekend Financial Sense Newshour listeners, then you have no doubt heard me discuss how the Chinese economy has been stabilizing after a number of accommodative moves by the People’s Bank of China (PBOC) have been implemented since this summer. While a bottom in the Shanghai has been elusive at best, it is clear that the pendulum has swung from greed to fear over the past two years. When the Shanghai Stock Exchange Composite broke 2000, Chinese investors rushed for the exit door a couple of weeks ago, with the number of Chinese stock accounts containing funds dropping 205,000 to 55.6 million according to Bloomberg in the week ending November 26th. That was the largest decline since the week ending July 8th, 2011. While bottoms are a process, let’s view all the evidence, both technically and fundamentally, that may be pointing to a bottom in Chinese stocks.
Fundamentals
I track the flash and the final purchasing managers Index (PMI) data on the radio show any time it comes out because it’s a good indicator to follow concerning Chinese manufacturing and services activity (as well as Europe and the U.S.). On December 3rd, it was announced that the PMI data increased to 50.5 in November, the first sign of expansion in the data since April this year. We’re still on the razor edge of a flat economy, but the data showed the sharpest increase in activity since March 2011. As you can see from the chart, we have a trend breakout in the indicator.
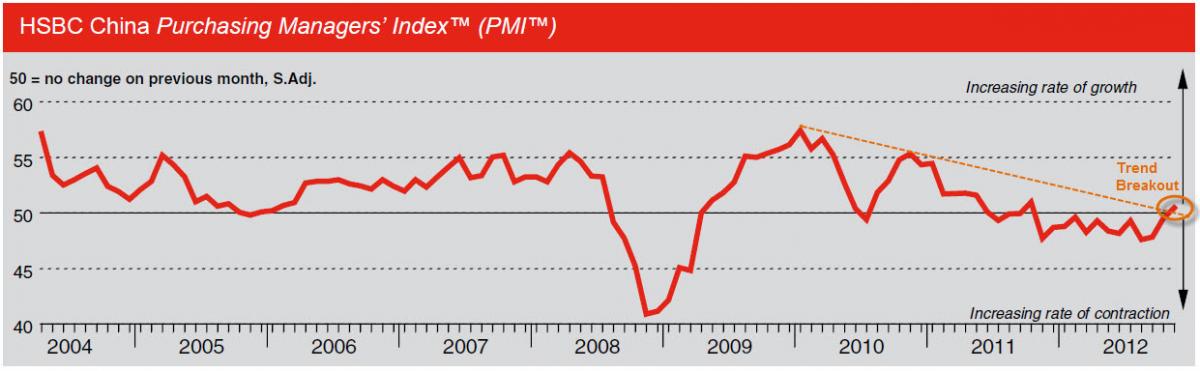
Source: hsbc.com, compiled by Market Group
There was a lot of good news in the report. New orders rose for the second month in a row and new export orders rose, the first time since April. About 17% of the panelists indicated growth, suggesting that their growth was due to strong demand in Europe and the US. Inventories of finished goods were being drawn down due to sales while input prices rose the second month in a row. Employment hasn’t improved any with 88% saying they don’t anticipate any change in staffing levels.
The services PMI was released on December 5th for November activity. It too posted an expansion reading at 52.1, albeit at a lower rate than in October (53.5). New orders continue to rise, a leading indicator on activity in the future, but the level of outstanding business at service providers fell at the fastest pace since February 2009. On the bright side, the workforce continues to expand; however the increase in the workforce is drawing down the backlog at an accelerated pace. Some of the panelists responding to the PMI survey indicated that the increase in hiring was due to the amount of new business.

Source: hsbc.com, compiled by Market Group
The flash PMIs will be released tonight with the EU and US tomorrow morning for December activity, thus far.
Industrial Production in November increased by 10.1% compared to a year ago, the strongest performance since March. That doesn’t sound like an economy that’s falling off a cliff now does it as many suggested of the country in September. In additional to an increase in industrial production, retail sales were up 14.9% in November compared to a year ago.
Economists at Moody’s Analytics believe we’ll see solid growth in 2013, but below long-term potential rates. They believe those long-term rates may be possible at the end of 2013 which may have a negative impact down the road if inflation costs become debilitating again, especially for the U.S. consumer.
During the earnings season, Caterpillar (CAT) and United Technologies (UTX) confirmed at the micro level that conditions are improving in China. While Caterpillar continues to reduce inventory levels to match sales, they believe recent government fiscal and monetary policy actions will lead to growth in the construction industry in 2013. United Technologies voiced similar hopes in China at their Otis Division, which is the primary driver of growth at the company. Chief Executive, Andrew Liveris, of Dow Chemical (DOW) last week voiced concern over the Chinese economy due to the slow growth in 2013 combined with the leadership transition last month he said created a disruption to their supply chains and pause in economic growth rates. Despite his concerns for results in the better part of 6 months in 2013, he said sales have picked up in recent weeks which seemed to have a positive effect on industrials and basic material stocks last week in the U.S.
Yesterday Joy Global (JOY), another proxy for Chinese sentiment, reported a 23% rise in net income for the fiscal fourth quarter. While below the street print consensus, longs seemed to feel more comfortable buying materials and industrial stocks on the news, even before the Federal Reserve’s announcement to replace Operation Twist with QEternity+ (long-term purchases will no longer be sterilized and maintained at B). Joy Global ended the day up 4%.
Fundamentally, China’s economy is improving. It’s a little early to say there’s a new trend there, but the signs are definitely encouraging. Manufacturing, retail sales, and industrial production all indicate that China may be at or past a bullish economic inflection point.
Technicals
Before looking at the Shanghai Stock Exchange Composite Index, let’s look at some of his neighbors, starting off with the Kospi or the South Korea Seoul Composite Index. With 60% of their economy dependent upon exports, the KOSPI is a good baramoter of global growth. With 40% of its exports going to China, it’s also a good indicator for growth in China. Looking at the chart of the KOSPI, we’ve had a series of higher lows since the summer correction of 2011 and the declining trend from 2011 has broken, but we have yet to see a breakout above a key resistance level near 2050. Overall the chart looks neutral to moderately bullish to me. A breakout above 2050 would confirm a transition to a more bullish outlook.

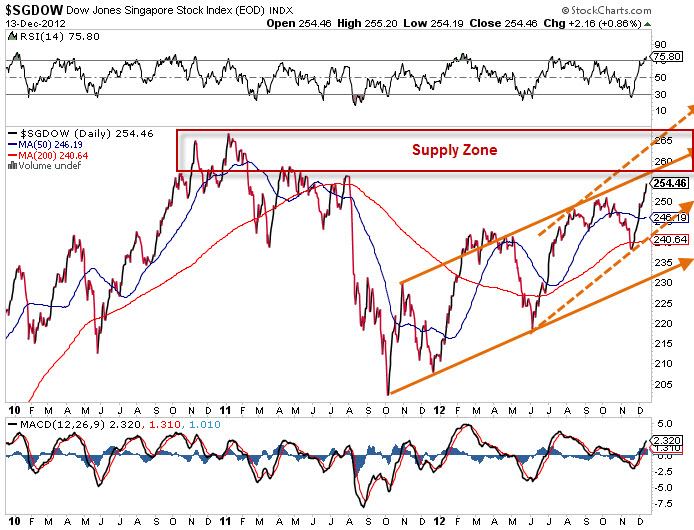
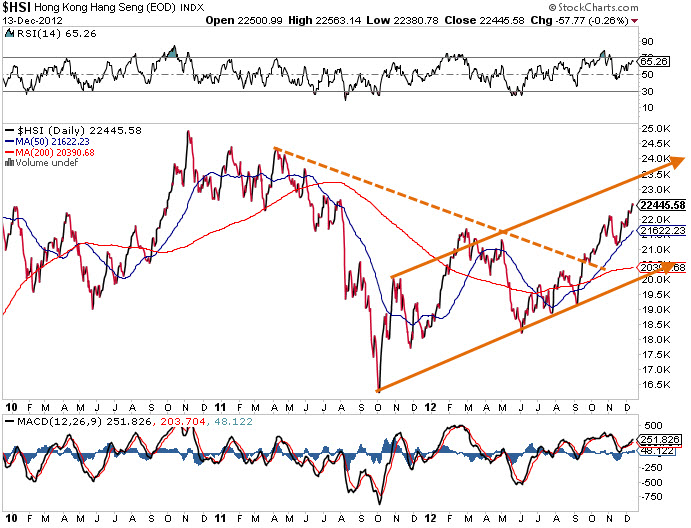
Here are a couple more Asian Indexes to also consider besides the KOSPI. While Korea is important to Chinese trade, Singapore and Hong Kong are the wealth management hubs of the region. Many mainland Chinese stocks have dual listing with “h-shares” listed on the Hong Kong Hang Seng Index. Both charts show a clearly bullish trend.
We look even to the Tokyo Nikkei Average with Japan playing a large part of Chinese demand. Recent economic data suggests Japan is in a recession. With China as the number 2 economy now and Japan as the number 3 economy in the world, following the Nikkei is just as important as following the Shanghai concerning the global economy.
Looking at the chart below, it’s easy to see that the current rally is within a bear market. We’re at 9,742 now after a rally from 8,619 on November 13th.Technically speaking, 2011 support has held throughout 2012. One of the first warning signs of a major trend reversal is when price is unable to reach the lower or upper trendline in a trend channel. In this case, the Nikkei Average failed to reach the lower trendline in the current trend channel. This is a bullish warning of a possible trend change. The change would be confirmed if the Nikkei can close above 10,000.

Last but not least, we look at the Shanghai Stock Exchange Composite – an ugly chart. Despite the recent stint to new lows near 1949, the Shanghai stock index has rallied back up to the 50-day moving average near 2063. This chart still has a ways to go before a bottom can be even identified as forming, but the rally from new lows back above 2000 is a good first step. Currently we’re testing the declining trendline from the 2011 top and the 2012 top in May. A break here would be a bullish inflection point for the Shanghai.

Conclusion
While a bottom has been long in the process (we had the development of one mid-2012 until economies started to rollover in April) for Chinese Stocks, charts for the South Korean, Singapore, and Hong Kong equities indices are indicating that there may be some truth in the matter. Many businesses within China have attributed the recent downturn in China based on the leadership transition that finally completed in November while others continue to point towards Europe. The Purchasing Managers’ Index from November indicated that business is picking up now following those events, with demand showing from both the U.S. and Europe.
Investing in China now would be the Contrarian thing to do, yet I’ve begun reading how funds are flowing again to the country through the Hong Kong h-shares. In most of the forecasts I’ve begun hearing on 2013, many analysts are suggesting investing abroad as opposed to the US. That seems like good advice right now based on our issues with the Fiscal Cliff and the Federal Reserve’s QEfinity plan. As my Uncle Bill Puplava has told me, “Sometimes I pick bottoms…I just follow fear.” There was plenty of that a few weeks ago with the stint below 2000. Capitulation may be at hand and already the bullish calls are being made like in Tom Demark’s comments last week.
Bottoms are a process. I’ll be sure to follow this one’s as it’s one of the most important themes I see right now in the market.


