


In last week’s article I elaborated on why it’s important to allow the economic backdrop to guide us when price action becomes erratic. Today, I thought we would take a short tour of the economy to see how some of the more important elements are trending.
As you’re well aware, GDP for the second quarter came in at 4.2%. That represents an uptick from the growth rates we saw over the last couple of years, and is the fastest annualized rate of growth since 2014.

Let’s begin our discussion by taking a look at which components of GDP (Consumption, Investment, Government Spending and Net Exports) are driving this growth, and then we’ll examine some of the other important measures of the economy such as employment and financial conditions.
Consumer spending is by far the largest overall driver of our economy, accounting for nearly 70% of GDP. Thus, the state of the consumer is a very important consideration in assessing the potential for future growth.
In the chart below, we can see the year-over-year change in consumer spending. Take note that in this chart, we are looking at real (inflation adjusted) figures.

Here we can see that over the past three years or so, real consumer spending has grown steadily at 2-3%. Right now it appears that we’re seeing neither an acceleration or deceleration in consumer spending, with the latest figure coming in at 2.8%.
It’s worth noting that we do tend to see a minor slowdown in the growth rate of consumer spending in advance of recessions (see chart above from mid-2005 to 2008), but consumer spending is generally NOT contracting when a recession first hits. This means we should be on the lookout whenever this metric does begin to roll over.
Read More Richard Duncan: Full-Blown Trade War Would Crash the Global Economy
Right now, the steady growth in real consumer spending (nominal consumer spending is actually increasing – but so is inflation) implies that this component of the economy remains on stable footing.
Some have suggested that while consumer spending may be holding up fine now, it’s the result of overspending on behalf of consumers in a way that is unsustainable. I tend to disagree, and the chart below lends credence to that viewpoint.
Here we can see that the ratio of household debt service payments to disposable personal income is near the lowest level in decades …

In the following chart, we can also see that the Personal Savings Rate remains higher than it was for nearly the entirety of the previous economic expansion (2001 – 2007).

Moving on, the next biggest component of our economy is business spending (approximately 18% of GDP in 2017). While so called “Private Domestic Investment” may not account for nearly as great a chunk of our economy, business spending plays a very important role in the health of our economy.
This is due to one specific reason: business investment directly influences productivity. Recall that there are only two fundamental ways our economy can grow – the labor force itself can grow (more people producing goods), or the productivity (output per worker) can grow. When businesses fail to invest, we tend to see lackluster productivity growth, which can contribute to a stagnation or decline in overall economic activity.
Below we can see that the year-over-year change in business spending has slowly crept higher over the last two years and currently sits at 4.8%.

Another reason why it’s a good idea to keep an eye on business spending is because this metric has a tendency to go negative in advance of approaching recession. You can see two examples of this in the chart above, but a longer timeframe would show more instances in which this was the case.
Just keep in mind that the year-over-year change in business spending CAN go negative without triggering a recession (we saw this in late 2015 – mid-2016) … in these cases other elements of the economy (namely consumer spending) remain strong enough to keep economic growth in positive territory.
Next up is a quick look at government spending, which accounted for roughly 17% of the economy in 2017.
Note: if you’re paying attention, you may have noticed that the three components of GDP that we’ve discussed so far sum to greater than 100% of the economy (70% Consumer Spending + 18% Business Spending + 17% Government Spending = 105%) … how is that possible? It’s because, as we’ll see shortly, the final component of the economy – Net Exports – actually subtracts from overall GDP.
But first, here’s a look at Government Spending on a year-over-year basis.
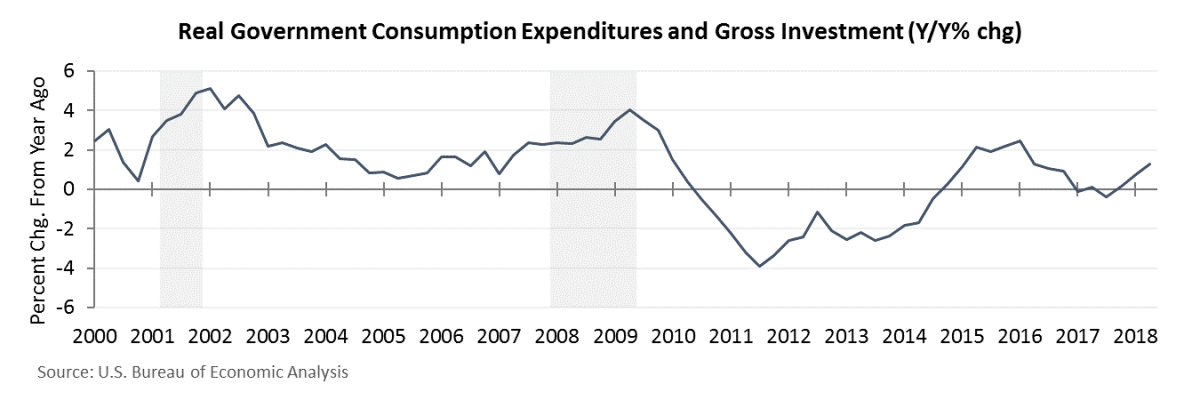
After falling negative briefly during 2017, Government Spending has increased and was recently up 1.3% for the second quarter. This shouldn’t come as too much of a surprise, considering some of the policy changes we’ve seen recently.
Now let’s take a look at the final component of GDP – Net Exports.
View More ECRI: Stealth Slowdown Unfolding Well Before Trade Tariffs
When we talk about trade with other countries, Imports and Exports have opposite effects on GDP. Exports add to GDP, while Imports subtract from GDP. As you know, the U.S. imports more than it exports, which creates a trade deficit.
In 2017, exports added about .5 trillion to GDP, but imports subtracted .3 trillion. The net result was a decline in GDP of about 9 billion, which is about 5% of GDP. Now our math adds up (70% Consumer Spending + 18% Business Spending + 17% Government Spending – 5% Net Exports = 100%).
Looking at real Net Exports on a year-over-year percent change basis (as we did with the other components of GDP) doesn’t provide an intuitive picture because we can have a positive growth rate even as net exports remains a negative to overall GDP. So instead, I’ll just show the data itself.
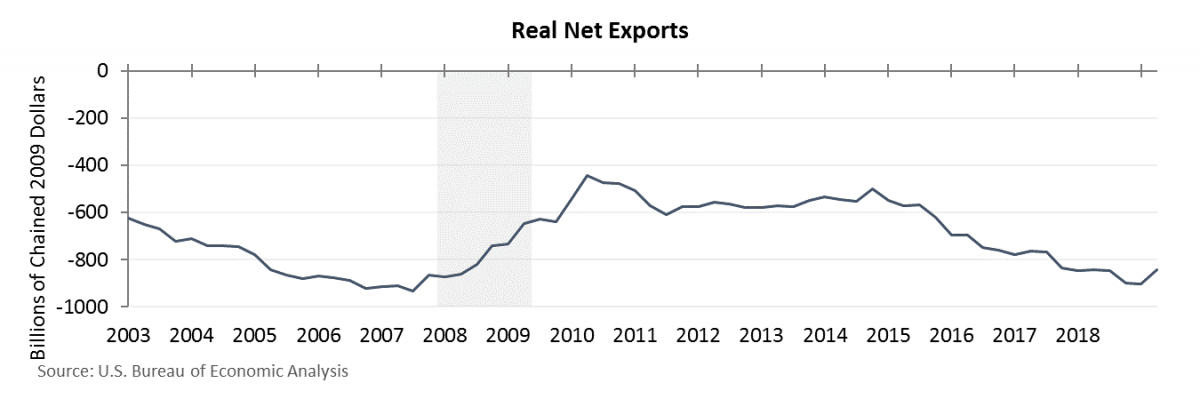
When this line falls, it means imports are rising in relation to exports. When it rises, exports are rising in relation to imports. As you can see, during the second quarter of this year (the most recent data point) we saw the first uptick in quite some time. Could this be the start of a new trend? Hard to say at this point, we’ll really have to wait and see … but this is what the trade war is all about.
So there you have it … 4.2% annualized growth due to steady consumer and business spending, rising government spending, and a small uptick in net exports.
My plan for today was to continue this discussion and get into some of the finer aspects of the economy, such as a few of the leading indicators, employment, financial stress, etc. But as I’m running low on time, I’ll have to save that for next week perhaps.
What I would like to mention briefly before I sign off is the concept of inertia. I’ve brought this up many times, but I think it bears repeating. Our economy has a strong element of inertia to it, meaning it’s very difficult for the economy to stop and change direction quickly.
Think of it like a freight train that’s speeding ahead … regardless of what’s on the tracks, the train can usually plow right through it while losing little speed. It is possible to slow down and reverse the train, which we see every 5-10 years or so in the form of a recession, but this process is gradual and drawn out, not an immediate event.
As long as we keep our eyes on this economic freight train and don’t become complacent, we should be able to get off as it’s slowing down … well before it comes to a complete stop and begins to head backwards.
The preceding content was an excerpt from Dow Theory Letters. To receive their daily updates and research, click here to subscribe. Matt is also the Chief Investment Strategist at Model Investing. For more information about algorithmic based portfolio management, click here.


