


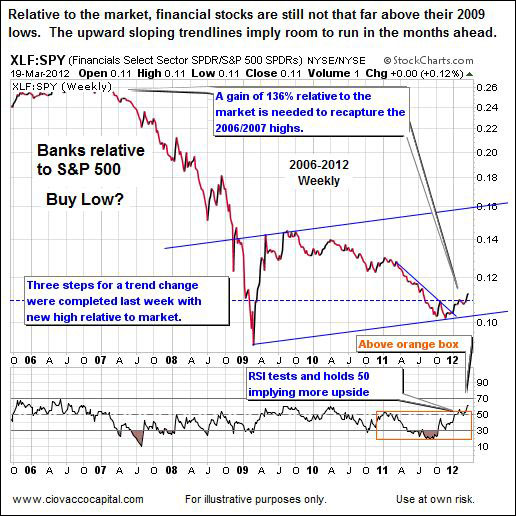
Financial stocks have been immensely disliked by investors relative to other options since the peak in late 2006/early 2007. If you look at the performance of financial stocks relative to the S&P 500 on a longer-term basis, the recent “surge” off the December 2011 lows is far from significant in the context of how far this sector has fallen. The XLF ETF would have to outperform the S&P 500 by 136% just to get back to “break even” relative to 2006/2007. Some other notes from the chart below:
- A basic trend change requires three steps: (1) break of a trend line, (2) a higher low, and (3) a higher high. The chart below completed step three last week (see new high above dotted line).
- RSI, or the Relative Strength Index, recently broke 50 and then successfully retested it. The bulls are in control of a market with an RSI > 50. The level as of Monday’s close was 61, which means there is room for a pullback in financials.
We noted last week (see video) bullish developments in financials relative to the S&P 500. Below are some excerpts from a Yahoo Finance interview with Katie Stockton, chief market technician of MKM Partners:
After gaining 25% year to date, stocks in the financial sector have only just now become interesting to technical analysts.
Yes, the chartists are late to the party but their skepticism is not without merit. Stocks making up the Financial Select Sector SPDR (XLF) have been the whipping boys of the popular press and investors for the last 5 years; eliciting absolutely no sympathy whatsoever on the way. Even with 2012’s move, the XLF is still nearly 60% off the highs of 2007.
So why bother with the group now? According to Katie Stockton, chief market technician of MKM Partners, the reason is simple: the stocks just broke out, “not just on an actual basis but on a relative basis.” That means the financials are outperforming the broad tape, most tech, and certainly the defensive sector names.
Better still, the XLF is being driven not by one or two names but across most of the constituent members. “When you see a lot of breakouts over the 200 day, that’s when you can believe the move as being somewhat sustainable,” says Stockton.
To put some perspective around the weak relative performance of financials since late 2006, consumer discretionary stocks (XLY) would have to fall over 10% relative to the market to revisit 2006/2007 levels (see chart below). XLY probably has more upside in the months ahead, but financials offer a better “buy low, sell high” opportunity. If markets are mean reverting, financials have some significant catching up to do. If the recent breakout in financials fails, it would send up a yellow flag for all risk assets.

The comments and charts above speak to an intermediate to long-term time horizon. Even if the recent breakout in financials holds, pullbacks and corrections will occur from time to time.
Source: Ciovacco Capital


