


By Chris Puplava
Chief Investment Officer, Financial Sense® Wealth Management
May 11, 2020
Executive Summary:
- The stock market has responded to unprecedented stimulus with a “V”-like recovery since March.
- The projected Federal budget deficit will hit levels not seen in our lifetimes, pushing debt-to-GDP over 100% which has not been seen since WW II.
- While financial markets have witnessed “V”-like recoveries, the economic recovery is likely to be more “U”-like in its shape.
- Post-WW II history argues the bear market is over, though we recognize we are in uncharted territory.
- The road ahead is likely to prove bumpy, just as the post-Great Depression and Great Recession period were.
- Volatile periods argue for active management, shifting to and from risk assets as volatility ebbs and flows.
- Currently, stocks provide greater investment appeal relative to bonds which is why we are underweighting fixed income.
- We will continue to monitor the COVID-19 outbreak and response, shifting client capital when prudent.
The one common theme that has prevailed over the last two years has clearly been volatility as we have witnessed not one but two bear markets. The S&P 500 fell 20.2% in the fourth quarter of 2018 and the 2020 bear market saw the S&P 500 fall 35.4%. The bear market this year was the swiftest we have ever seen, taking only 16 trading days for the S&P 500 to decline over 20%, while it took 113 trading days from 2007-2009.
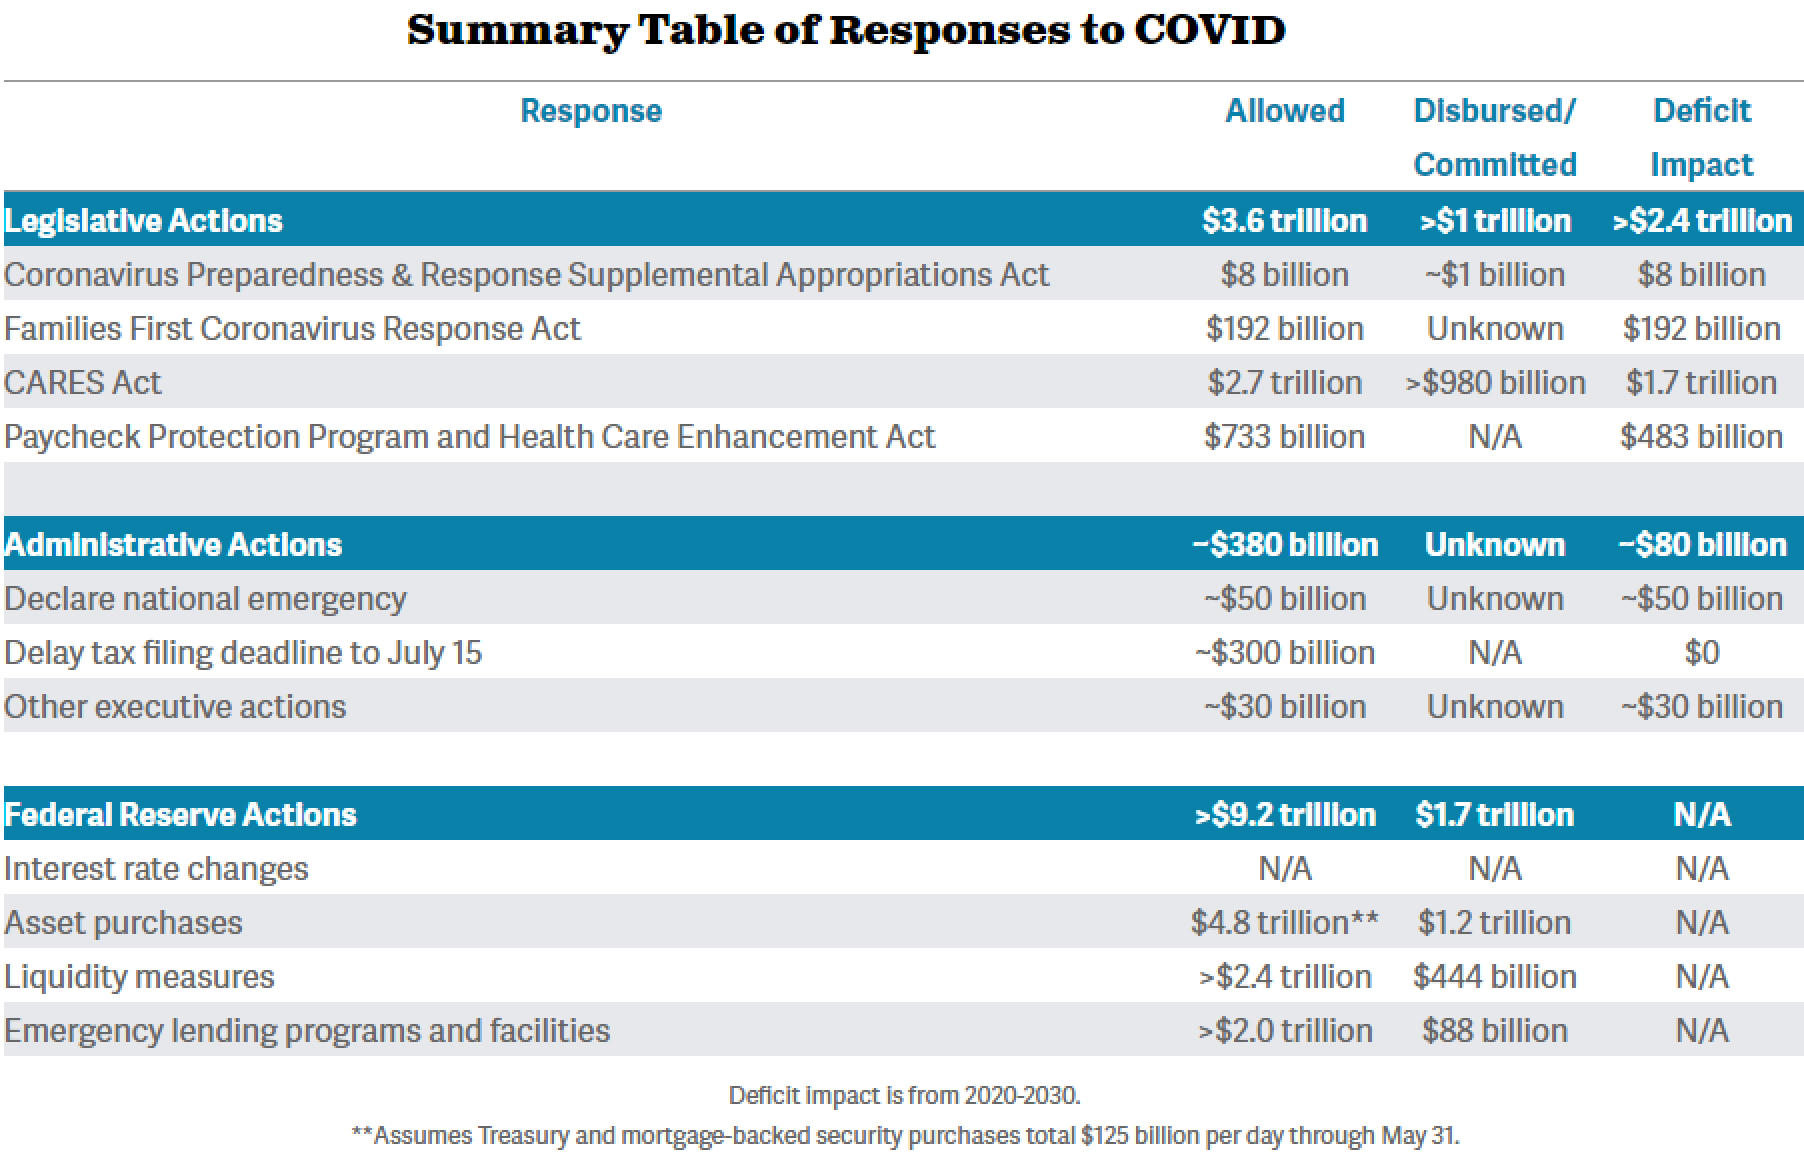
With the 2018 mini bear market, we witnessed a “V”-shaped recovery in stocks as the Federal Reserve (Fed) made a dramatic U-turn in its language and tone from tightening to easing, followed by interest rate cuts in seven months, and the expansion of its balance sheet (direct stimulus) in nine months. Fast forward to today and, just as swift and momentous the most recent decline has been, so has the response from the Fed and fiscal authorities. The combined legislative measures of the federal government amount to $3.6 trillion with just over $1 trillion disbursed or committed already. The fiscal response, however, pales in comparison to the monetary response as the Fed’s actions have allocated $9.2 trillion in purchases, liquidity injections, and lending programs with $1.7 trillion already disbursed. A summary of the responses taken to address the COVID-19 viral outbreak is highlighted below. These actions have led to another “V”-shaped recovery in the markets with the S&P 500 retracing more than half of its decline.
The U.S. was projected to run a $1.1 trillion deficit this year. The viral outbreak has now more than tripled that number, pushing it to an estimated $3.8 trillion for 2020 and $2.1 trillion for 2021. The economic impact of shutting down the economy has led to the sharpest economic decline since the Great Depression and will lead the budget deficit to hit the highest levels relative to the economy, as measured by gross domestic product (GDP), in the last half-century. The worst the deficit fell to was -10.1% of GDP in 2009 and this year will nearly double that at -18.7%. Next year will be just below the 2009 recession at -9.7%.

The last time the federal debt outstanding exceeded the size of the economy was in 1946 in response to WW II. Due to the amount of deficit spending this year, debt is likely to exceed the economy again well into this decade.
Where to From Here?
Parts of the country and world are beginning to reopen their economies as their daily case growth rate has flattened and declined. This will start to ease the economic damage being done and we are already seeing some encouraging signs here in the U.S. where initial unemployment claims have fallen for four straight weeks. We are still adding millions to the unemployment ranks each week, which is horrific, but it is still encouraging to see the growth of the unemployed beginning to slow. This will likely only improve further as the economy begins to reopen. So far, we have seen a “V”-shaped recovery in the financial markets. Will we see the same in the economy, or something closer to a “U” (slower recovery) or an “L” (flat recovery)?
Some strategists and economists believe we will see a quick rebound, similar to what often transpires after a natural disaster. This is not our view as natural disasters rarely lead to lasting psychological shifts in consumer and business behavior. Those who lived through the Great Depression embodied frugality through much of their life and consumers who racked up debt at a blistering pace during the housing bubble spent the last decade repairing their balance sheets. These types of persistent changes in behavior are not associated with a localized natural disaster but, instead, are born from widespread economic and financial hardship as we are witnessing today.
It is not likely that the increased online shopping by consumers and businesses will completely revert to pre-COVID levels, which will put a strain on retail commercial real estate. We are also likely to see reduced travel both domestically and abroad for some time as fears of renewed outbreaks persist until a viable vaccine is created. Given the current crisis was not brought on by a natural disaster, our belief is that a “V”-shaped economic recovery is not in the cards but something more akin to a “U”-shaped recovery that takes place over not one quarter but at least a year. Current estimates compiled by Bloomberg show the median estimate for the unemployment rate at the end of the year is just over 9%, just below 7% by the end of 2021, and close to 5.5% by the end of 2022. Highlighting the argument that it will be a process for the economy to recover ahead was the May 5th announcement from Airbnb that it plans to lay off 25% of the company’s workforce as it prepares for life post-COVID-19. Comments from CEO Brian Chesky are provided below:
Airbnb to lay off nearly 1,900 people, 25% of company
“We are collectively living through the most harrowing crisis of our lifetime, and as it began to unfold, global travel came to a standstill,” Chesky told employees in a note. “Airbnb’s business has been hit hard, with revenue this year forecasted to be less than half of what we earned in 2019.”
Prior to the layoffs, Airbnb had 7,500 employees, Chesky said. Airbnb will halt projects related to hotels, a transportation division and luxury stays, Chesky said.
“Travel in this new world will look different, and we need to evolve Airbnb accordingly,” he said.
Where Does the Stock Market Fall in the Alphabet Soup?
If the economy is likely to undergo a slow recovery, more representative of a “U” than a “V,” the question many are asking is what kind of bottom will the stock market have and, more importantly, is the bear market even over? To provide some context to that trillion-dollar question, our firm analyzed all post-WWII bear markets and then looked at all major rallies once the bear market criteria (20%+ decline) had been met. Our goal was to see what helped delineate bear market rallies that resulted from a bottom from those that kicked off new bull markets after the bottom was in. Given the S&P 500 has already retraced half of its prior decline, we initially started from that criteria to see what the market did after it had retraced at least 50% of its prior decline. Of the thirteen bear markets we studied, only one of them went on to make a new low by falling 1.6% further below the initial low (1946-1949 bear market). The other twelve cases were not bear market rallies but in fact the beginning of a new bull market.

We wanted to look at a few statistics to see what kind of volatility we could see in the three- and six-month period after the 50% retracement mark was hit for those twelve post-bear market rallies, and what we saw was that volatility dramatically tailed off after the bottom was in, which is a characteristic hallmark of new bull markets relative to bear markets. Of the twelve cases studied, the maximum decline seen over the next three months was 5.84% and the maximum decline seen over the next six months from that 50% retracement level was 7.99%. Looking at average returns, the average three-month return after the 50% retracement was 5.82% and six months was 6.45%.
Volatility & Return Characteristics Post a 50% Bear Market Retracement
Average Max Drawn:
- 3 Months = -5.84%
- 6 Months = -7.99%
Average Forward Return:
- 3 Months = 5.82%
- 6 Months = 6.45%
Since the S&P 500 has rallied further to retrace at least 61.8% of its prior decline (a common technical retracement level), we looked at all cases in which that feat was met and whether the bear market continued on to make new lows. Of the twelve cases seen, not one went on to make a new low. Using the twelve cases, we wanted to see what their path looked like post the 50% retracement to serve as a yardstick to measure the current market. So far, the S&P 500 is hugging the average path taken by the S&P 500 after retracing half of the bear market decline. If the S&P 500 underwent the worst-case scenario seen from the 12 cases studied three months after the 50% retracement mark, the lowest value for the S&P 500 would be 2,707 while the best case would be 3,291 and the average would be 3,017

Looking back at the last 75 years of stock market history suggests the bottom is in and pullbacks over the next 3-6 months should be shallow. While the data above is encouraging, we fully appreciate the unusual circumstances affecting today's economic environment, which is why we are remaining open to all possible outcomes for the market moving forward.
A Bumpy Road Ahead
We know that there are few alive today that lived through the 1918 Spanish Flu—the last time we experienced a global pandemic of this scale—which highlights how extreme the current situation is. It is unlikely we will return to full employment and pre-crisis economic levels anytime soon, which means the road ahead is likely to be bumpy. During the Great Depression, after the stock market bottomed in 1932, the S&P 500 witnessed a 100% rally and a 40% bear market all in the first year and then witnessed two additional bull and bear markets through 1935.
Coming out of the 2007-2009 Great Recession we witnessed dramatic stock market moves in the first three years in which the S&P 500 rallied over 80% heading into 2010 only to fall 17% that year. The S&P 500 rallied over 35% off its 2010 lows before going through a short bear market in 2011 followed by another 30% plus advance heading into 2012. Large economic and financial shocks, like an earthquake, often have aftershocks that take place after the initial shock occurs and we are likely to see the same outcome over the next 1-2 years.
What often characterized the booms and busts after the initial 2009 bottom was the on-again, off-again quantitative easing (“QE”, AKA: money printing) programs by the Fed. The Fed’s QE1, QE2, and QE3 programs all levitated stocks but once their planned end was within sight so too was the stock market’s rally. As shown below, over the last decade there has been a clear relationship between the annual rate of change in dollar liquidity and the annual rate of change of the stock market.

When the government expands its debt burden and when the Fed expands its balance sheet, all that money must go somewhere. Often, it ends up bidding the prices of financial assets higher relative to finding its way into the real economy. Looking back at the last decade is a clear example of this. Since the S&P 500 bottomed in March of 2009, every $1 increase in the Fed’s balance sheet has coincided with a $1.12 increase in the S&P 500, a $0.46 increase in GDP, and a $0.37 increase in the Consumer Price Index (CPI).

While correlation does not imply causation, clearly all the money printing in the last decade appears to have influenced Wall Street far more than Main Street. When money is created it has to go somewhere and you can have either asset inflation or goods and services inflation, and we’ve experienced the former over the last decade and will likely witness this trend again with all of the current monetary and fiscal stimulus being thrown at the stock market and economy. Therefore, we believe monitoring the pace of stimulus as well as the pace of COVID-19 cases will be vital to know when to increase and reduce risk to help smooth out the bumps ahead.
Winning By Not Losing
"It’s more important to ensure survival under negative outcomes than it is to guarantee maximum returns under favorable ones." – Howard Marks
Sometimes successful investing is not about choosing the best investment, it is not choosing the worst investment. While there is plenty of risk inherent in the stock market, the bond market also carries plenty of risk as well. Bond prices move inversely with interest rates, meaning that when interest rates rise, bond values fall and vice versa. What is also important to grasp is that the interest you receive from your bond investment can help cushion the blow when interest rates rise. Therefore, there is a great deal of investment risk in owning government bonds as we are back to ZIRP (Zero Interest Rate Policy) and NIRP (Negative Interest Rate Policy) in all the developed countries and parts of emerging markets. Furthermore, considering the economic and financial market shocks, the market is betting that the Federal Funds rate will be under 0.25% looking out as far as three years. As dismal as that sounds, the market is pricing in even lower expectations for most other countries.

Considering the low interest rate environment, the stock market carries far more investor appeal than bonds. The dividend yield of the S&P 500 relative to the 10-year US Treasury is the highest it has been since 1970, even exceeding the differential seen at the March 2009 lows. The stock market also carries more income appeal than the corporate bond market. The S&P 500 dividend yield relative to corporate bond yields also reached a record over the last half-century as seen below.

Over the last two months we went from a maximum risk posture in terms of our allocation to stocks to a minimum risk posture. Currently, we are at or just above a neutral allocation to stocks in our various asset allocation objectives per the table below, with an underweight to bonds to make room for precious metals.

Beyond the relative value argument for stocks over bonds, tactically we believe it makes sense to underweight bonds as history has shown that when the Fed expands its balance sheet (black line below), we’ve seen a general rise in interest rates (10-yr US Treasury yield shown in red) as highlighted by the green shaded regions. When the Fed took its foot off the money printing accelerator, interest rates have tended to fall (red shaded regions). We are currently witnessing the largest and steepest increase to the Fed’s balance sheet, which is why we believe that interest rates are more likely to rise than fall over the next year.

Portfolio Strategy
As mentioned above, our client accounts have a slight overweight tilt to stocks and we have increased our exposure to commodities in our more aggressive accounts by complementing our gold bullion exposure with gold and silver mining stocks. The first two rounds of QE by the Fed witnessed gold and silver hitting all-time highs and with gold hitting all-time highs in virtually every world currency but the US dollar, it would not surprise us to see gold hit new all-time highs in the coming year.
We took advantage of the major sell-off in corporate bonds in the last two months by shifting away from bond ETFs, which we sheltered in when there was a lack of value presented to us by the market, to individual corporate bonds ranging from 1-5 years in maturity. Further, given the lack of yield in US Treasuries, we have reduced our exposure to the space to shift more client capital to higher-yielding corporate bonds.
There are major unknowns ahead in terms of the size and scope of future COVID-19 outbreaks, particularly as the U.S. and parts of the world reopen their economies. Further, we also do not know how quickly a viable vaccine will be developed or if medical therapies to treat COVID-19 cases can be both approved and scaled up to meet future outbreaks. Given the world’s brightest scientists and government resources are behind solving these challenges, there is cause to be optimistic about the outlook, but we also know we must be realistic about the challenging road ahead. Therefore, we will remain vigilant to shift overall risk exposure to the stock market depending on how incoming financial, economic, and medical data evolves.
We hope and pray for the safety of all our clients and want you to know our staff is here to address any of your needs and concerns.
Best,
Chris Puplava
Chief Investment Officer
chris[dot]puplava[at]financialsense[dot]com
888.486.3939 Toll Free, 858.487.3939 Tel, 858.487.3969 Fax
Post Office Box 503147 · San Diego, CA 92150-3147
10809 Thornmint Road 2nd Floor · San Diego, CA 92127
www.financialsense.com
Investment Advisory Services offered through Financial Sense® Advisors, Inc., a Registered Investment Advisor. Securities offered through Financial Sense® Securities, Inc., Member FINRA/SIPC. Both companies doing business as Financial Sense® Wealth Management. This message may contain confidential or privileged material. Any use of this information by anyone other than the intended recipient is prohibited. If you have received this message in error please immediately reply to the sender and delete this information from your computer.
Please be advised that voicemail, fax, or email instructions to buy or sell assets in your account are not valid and will not be executed. These instructions may only be received and acted upon in real time.