


There are times when the overall stock market becomes very selective, hiding damage beneath the surface, while the overall indices like the S&P 500, the Dow Jones Industrial Average, or NASDAQ power higher. The weak links of the market can either play catch-up and start to perform, or the major indices, whose foundations are weakening, can crack and finally roll over into a correction. For much of the last six months, the bulk of members within the S&P 500 stock index have been losing steam, even more so over the last three months. Going into September, we did not know which way this dichotomy was going to resolve itself, but now it appears it’s the latter case where indices are playing catch-up with their weaker members.
Stocks came running out of the gates to start the year with strong performances coming from nearly every area of the market, particularly the riskier, economically-sensitive areas like commodities and small cap stocks. However, as often occurs in races where some sprint to the head of the pack out of the gate often exhaust themselves and soon find themselves near the end, we’ve seen the same in the stock market. Beginning in March, the high-flying areas of the market began to lose steam and, as we moved into the middle part of the year, more and more stocks were falling behind the indices. Market returns were becoming harder to come by but you wouldn’t know it simply looking at the major stock market indices. The stock market was transitioning into the “MA Market.”
Bob Farrell’s Rule #7 at Work
Bob Farrell is a legend on Wall Street who started his career at Merrill Lynch in 1957. Farrell was one of the most sought-after strategists due to his timely market predictions. After multiple decades at the helm of Merrill Lynch, he distilled his wisdom into ten rules that are still widely cited today, and his seventh rule is clearly at work this year.
Rule # 7: Markets are strongest when they are broad and weakest when they narrow to a handful of blue-chip names
From the middle of March to the middle of September, the S&P 500 was being powered by only a handful of stocks that were doing the lion’s share of performance—two in particular. In the six-month period from March 15th to September 15th, Microsoft (M) accounted for 11.5% of the S&P 500’s return and Apple (A) accounted for 8.6%. The two together (MA) accounted for nearly 20% of the entire S&P 500’s return. Think about that for a moment, the S&P 500 is comprised of 500 stocks and just two—a mere two companies—were responsible for one fifth of the index’s return!
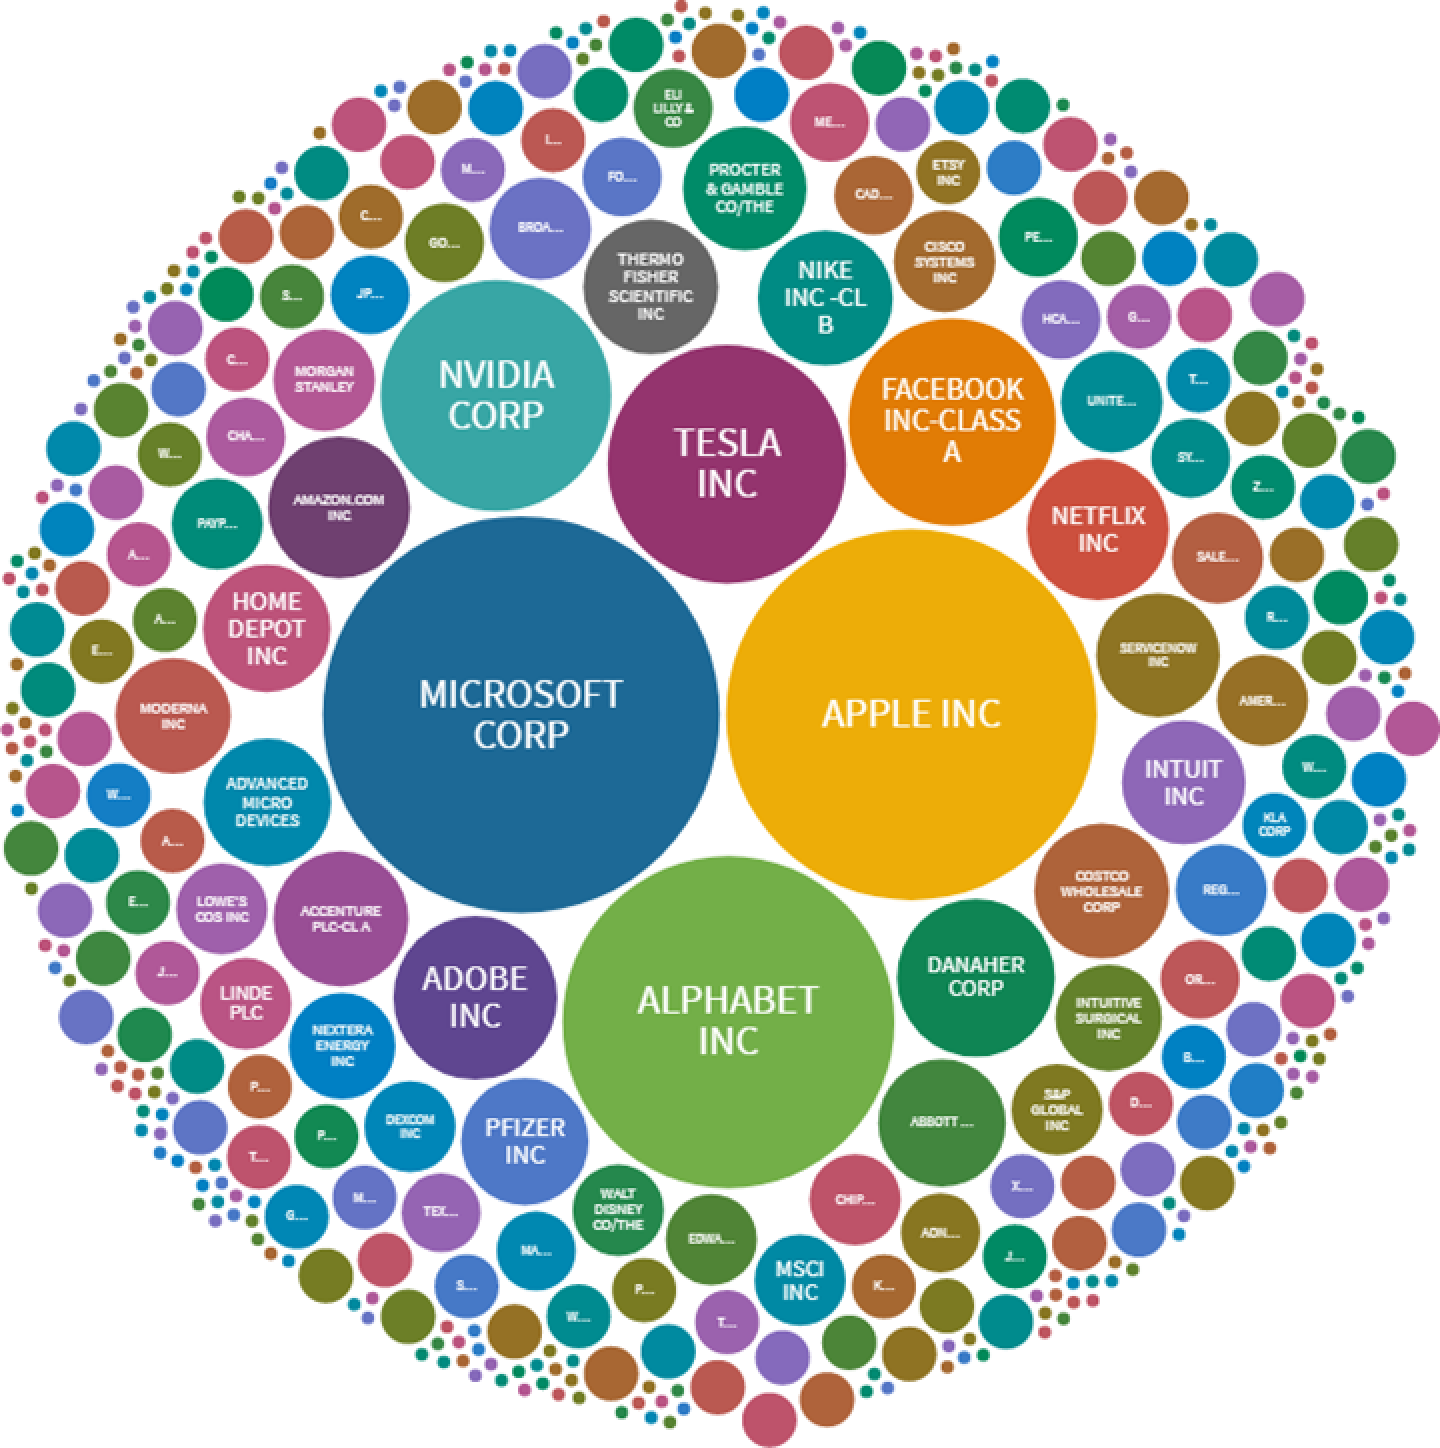
As was stated earlier, things only got worse over the last few months as MA together propelled the market to new highs, leaving the rest of the market in its dust. Over the last three months, Microsoft was responsible for 16.8% of the S&P 500’s return and Apple 14.6%. This has truly become the “MA Market” as the two were responsible for 31% of the S&P 500’s return. Literally, just two of the 500 stocks in the S&P 500 were responsible for nearly one third of the entire index’s return. Throw in the next top two (Alphabet and Tesla) and you have the top four companies explaining 49% of the S&P 500’s return over the last three months.
Shares of S&P 500’s Return from 06/15/2021 – 09/15/2021
With the economy recovering and asset markets rallying at the start of the year, what has happened to explain the change in tone? In our view, one of the biggest culprits to the loss of the market’s internal participation is a loss in liquidity, where the old saying “a rising tide lifts all boats” is no longer at play. We first touched upon this in our last newsletter (The Reflation Trade Under Fire) highlighting how a peak in bank reserves in the spring was associated with a peak in long-term US interest rates. Overall US dollar (USD) financial liquidity, as measured by broad money supply plus foreign holdings of US Treasury securities, has continued to decline since March/April as shown below. Further, we have seen the Fed’s overnight repurchase facility balloon from nearly nothing in March to over $1.2 trillion dollars being “drained” from the system currently. The repo facility began to surge in April/May and then exploded higher on June 16th after the Fed increased rates five basis points on the overnight repo facility from 0% to 0.05%. The Fed’s repo facility quickly doubled from roughly $500 billion to $1 trillion dollars in just two weeks as seen below.

While the U.S. has seen a peak in its liquidity, the decline in liquidity first began in China as they were the first into the COVID-induced downturn and the first out of it and so they were the first to put on the brakes on fiscal and monetary stimulus. It’s no wonder that emerging markets (EM), in which China represents more than a third of most EM indices, peaked first. The MSCI Emerging Markets Index peaked on February 18th of this year and is down ever since. Following the peak in emerging markets, we began to see a peak in the bond market as the U.S. 10yr Treasury yield peaked at the end of the first quarter on March 31st. As we moved into May, when liquidity really began to be withdrawn, we saw peak after peak of major areas of the market from commodities like copper to small cap stocks. A list of market peaks for 2021 is provided below:
- MSCI Emerging Markets – February 18
- Russell 2000 Small Cap Index – March 15
- 10-yr US Treasury Yield – March 31
- Dow Jones Transportation Average – May 7
- Copper Prices – May 10
- S&P 500 Materials Index – May 10
- S&P 500 Industrials – May 10
- S&P 500 Energy Index – June 10
Visually, we can see how the bulk of the market peaked in May along with a peak in USD liquidity (in red below). Bond yields (in green) and the Dow Jones Transportation Average (in blue) rose alongside liquidity prior to then and have fallen with it since, while the technology sector—particularly the highly selective “MA Market”—continued to power higher.

Again, looking at the list above makes it appear as though the peak in economically-sensitive areas of the market was on May 10th and when we look at market returns since then we can see that only two of the 10 main S&P 500 sectors have outperformed the S&P 500 while most have underperformed significantly. The technology sector has led the pack by outperforming the index by 9.2% and the telecommunications sector (led by Facebook and Alphabet) have outperformed the index by 5%. Cyclical sectors like energy, materials, and industrials have all underperformed the market in the last four months by double-digits. Mid cap and small cap stocks have also significantly underperformed the S&P 500 large cap index. So, unless you only held the technology giant capitalization stocks or just simply the S&P 500 Index, it has been a very bumpy and unpleasant ride over the last four months with the market displaying extremely narrow breadth.

Looking ahead, we are just over a year into the recovery after the COVID-induced recession of 2020 and economic expansions typically do not end until the Fed has tightened monetary policy and constricted credit growth. At present, the Fed is still buying over $100B of securities each month and while it is likely to begin tapering these purchases, it will continue expanding its balance sheet into 2022 and the first rate hike is not expected to come until 2023. The point is that we are undergoing a growth deceleration but we are still growing nonetheless and so the odds of an economic recession and bear market remain a low probability event. We will be monitoring the markets for liquidity, overall participation, as well as keeping an eye on leading economic indicators for signs of a reacceleration. With the Fed printing money, corporations buying back their stock at record levels, and the retail consumer pouring more money into the stock market than at any time in the last decade, there is still a tremendous amount of demand for stocks currently. The collective wallet of these entities is likely to overwhelm current selling pressure and should keep the bears in check.
To find out more about Financial Sense® Wealth Management or for a complimentary risk assessment of your portfolio, click here to contact us.
Advisory services offered through Financial Sense® Advisors, Inc., a registered investment adviser. Securities offered through Financial Sense® Securities, Inc., Member FINRA/SIPC. DBA Financial Sense® Wealth Management.
Copyright © 2021 Chris Puplava


