


In the upcoming days, members of the G20 are meeting in Buenos Aires where many eyes will watch the interaction between U.S. President Donald Trump and China’s President Xi Jinping. This could be the last chance for a ceasefire with tensions between the two powerhouse nations posing more of a threat to the U.S. economy. The hope and optimism surrounding a potential breakthrough between the two leaders lead to a rally in the markets this week.
In terms of market health, intermediate and long-term momentum sunk further while short momentum was average at best. Federal Reserve Chairman Jerome Powell stated Wednesday that he believes interest rates are close to neutral. This differs from the negative articulation in his remarks a few months prior. Settlement in the markets appeared ahead of the impending G20 conference but declines since October show that investors are still bracing for any negative outcomes.
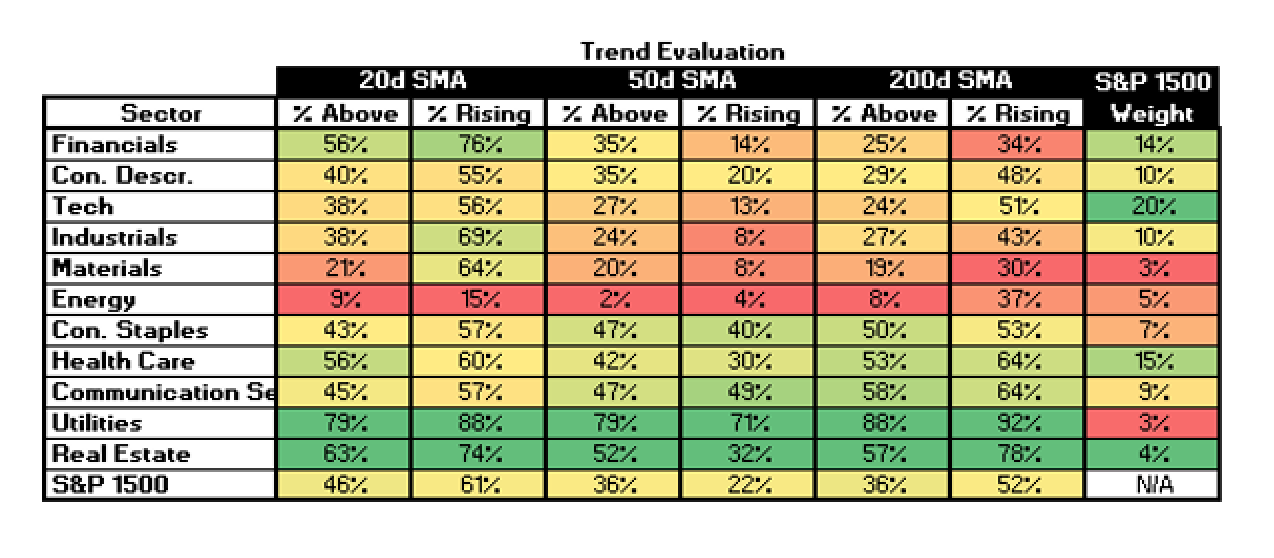
S&P 1500 Member Trend Strength
For the first time in what feels like an eternity, the U.S. markets experienced consecutive days of growth. This is helping to improve the market’s short-term strength as seen by the percentage of members within the S&P 1500 with bullish short-term trends push into bullish territory, with a current reading of 61 percent.
Additionally, the long-term outlook is neutral-bullish with 52 percent (or 780) of the 1500 stocks in the index having bullish long-term trends as measured by a rising 200 day moving average. The market’s intermediate outlook is still a cause for concern and is clearly in bearish territory as only 22 percent of the market have a rising 50 day moving average. This might coincide with the fact that the Fed raised the interest rates three times this year with another raise potentially coming next month.

As shown below, 52 percent of stocks in the S&P 1500 have rising 200 day SMAs and just 36 percent of its members are above their 200 day SMA. Additionally, half of the sector’s members show long-term bullish trends, highlighting a mediocre outlook.
For the past seven days, the weakness in the long-term S&P 1500 came primarily from cyclical sectors in which financials and consumer discretionary showed losses while the largest gains in uptrends once again came from more defensive sectors such as utilities and healthcare.
S&P 1500 Market Momentum
Overall, the market is facing weaker momentum in the intermediate and long-term. As shown in the table below, the momentum for the S&P 1500 is bearish in the forward looking outlook with two out of three signals calling to SELL.

Looking into the details for the 1500 stocks within the S&P 1500, we can see the daily momentum for the market has a neutral-bullish rating of members on daily BUY signals. Hopefully, with more positive updates from the Fed, we will see this percentage push higher in the days to come.
Intermediate momentum is where we see the percentage of the market remaining in bearish territory (33 percent). The market’s long-term momentum sits at the neutral-bearish rating at 44 percent.

Shown below, the financial sector continues to pull the main average down. With so much weight within the S&P 1500, it is easy to see the impact the financial sector has. Technology and financials together have the most overall impact, comprising roughly 30% of the S&P 1500. What is perhaps the most concerning is the weakness in the energy sector’s weekly numbers, showing only 5% of energy names showing MACD buy signals.

Conclusion
Whether it be news from the G20 summit or updates from the Fed, the market is looking for a trigger to make its move. It seems the market has been consolidating ahead of a busy reporting week filled with some potential market-moving events. Though short-term momentum has strengthened, the market’s long-term and intermediate momentum remain somewhat weak and indicate a remote risk of a bull market top. If the market is looking to regain its footing we need to see intermediate and long-term momentum improve. That said, the current red flag is the divergence in weekly MACD buy signals as subsequent peaks have trended lower. This divergence may foreshadow a market correction in the weeks ahead or it could simply indicate a high degree of sector rotation.


