


At the onset of 2018, market soothsayers gave their outlooks for the year. The consistent theme from every economic commentator and investment strategist was jubilation for the most synchronized global growth period since the 2008 financial crisis. The genesis of this glorious upturn began after the global growth slowdown starting in late 2014 where we saw several double-digit declines in risk assets that were eventually arrested in early 2016. The catalyst for the bottom arose when former Fed Chairwoman Janet Yellen made unscheduled calls with Governor Mark Carney at the Bank of England on February 11, 2016 and with European Central Bank President, Mario Draghi, the very next day. What do you get when the head of the world’s largest central bank has her only conversations with other central bank heads in their four-year term outside of a major convention? A market bottom!

Fuel was added to the fire when G20 finance ministers and central bank governors met in February 2016, which many in the financial media dubbed the “Shanghai Accord.” After this, the US dollar’s dramatic ascent from early 2014 began to decline. In the months that followed, China undertook both fiscal and monetary stimulus measures to stabilize economic growth and stem the tide of capital fleeing the country. This growth-boosting stimulus coming from China planted the seeds for future stability risks according to ratings agency Fitch in a report published in early 2017, as highlighted by a CNBC article with excerpts provided below.
Fitch: China’s stimulus measures paper over growth slowdown
...economic growth has come at the cost of delayed reforms and increased leverage, Fitch said in a report titled "China's stable growth reflects stimulus not sustainability."
"Short-term growth targets have been prioritized over some areas of structural reform, particularly efforts to reduce the economy's dependence on credit-intensive investment. Policy stimulus has succeeded in maintaining growth within the official target range, but it has come at the cost of a further build-up in leverage," Fitch said.
A combination of lower global interest rates, a weaker US dollar (USD), fiscal stimulus from the world’s growth juggernaut (China), lower commodity prices and accommodative central banks all over the world pushed global economies into a period of broad synchronized growth that began in 2016 and reached its zenith late in 2017. Thus, it was not surprising to see strong returns across the globe. What was surprising, was how easy it was to make money during the year. According to a Barron’s article, in 2017 “a dart-throwing monkey could have made money” as only one percent of the 70 asset classes from around the world tracked by Deutsche Bank delivered negative returns. That was well below the 29 percent average of financial markets delivering negative annual returns for data going back to 1901.
Not only were positive asset class returns abnormally elevated in 2017, but we also witnessed incredibly low market volatility. Looking at data going back to the Great Depression, on average the S&P 500 experienced 60 days in which the market fell or rose by more than one percent. In 2017 there were only eight days in which the market rose or fell by more than one percent and it never fell or rose more than two percent on any trading day.
As Night Follows Day...
In retrospect, 2017 really was an investors’ paradise of above-average returns and below-average market volatility. Great years can be problematic for investors and economists as they tend to forecast the future by extrapolating the past, which causes them to miss major turns in economic growth and the stock market. Therefore, we follow leading economic indicators and things that give us real-time data to determine where economic growth (and thus corporate earnings) are heading. While the consensus going into 2018 was a continuation of 2017’s synchronized growth and strong market returns, we were concerned that the outlook for the year would likely underwhelm expectations.
Just as lower interest rates and weaker currencies across the globe spurred future economic growth to stabilize, higher global interest rates and strong currencies began to sow the seeds of a weaker global economy as 2017 ended. This brings us to last year when all we heard about was synchronized global growth, but investors and economists failed to see that the global economy was beginning to splinter. Manufacturing activity in China peaked in September 2017 and displayed an outright decline in December 2018 with its weakest activity in nearly three years. Eurozone manufacturing activity peaked in December 2017 and is at risk of following China into contraction territory. Global manufacturing also peaked in December of 2017 and slowed throughout last year. U.S. economic growth continued to remain elevated through most of 2018 given the fiscal stimulus from the Tax Cuts and Jobs act of 2017.
The global economic synchronization of 2017 transitioned into disharmony as global financial markets suffered losses in the first half of the year while U.S. markets came through relatively unscathed. Buoyed by strong stock buybacks and record earnings, U.S. stock indices propelled to all-time highs closing out the third quarter of 2018. To US investors, everything looked fine…until it didn’t!
Comments from Fed chairman Jerome Powell were a strong catalyst for the stock market decline in the fourth quarter of last year as the S&P 500 entered an official bear market with its 20.2 percent decline from Oct. 3 to the low on Dec. 26. During a question-and-answer session with Judy Woodruff of PBS, Powell said that current interest rates were still low and that “we may go past neutral, but we’re a long way from neutral at this point, probably” (click for article link). Investors were already starting to see financial conditions tighten in the U.S. and priced in only two rate hikes for 2019. Powell’s comments that the current level of interest rates were well below neutral—a level that would neither stoke inflation by being too low nor cause a recession by being too high—were worrisome as market participants began to price in rising odds of a Fed-induced recession on the horizon.
Within a few weeks of those early October comments, the markets entered a sharp correction, falling more than 10 percent before rallying into the Nov. 7 midterm election. Throughout November, U.S. stock markets licked their wounds from the October beating and began to rally through the Thanksgiving holiday period as Black Friday and Cyber Monday retail results came in better than expected. Investors were encouraged that the markets would finish on a positive note when, on Nov. 28, Fed Chairman Powell said that interest rates were “just below” neutral (click for link), which caused the Dow Jones Industrial Average to rally 618 points and the S&P 500 2.3 percent.
The encouragement however quickly faded a few days later. Federal Reserve Chairman Richard Clarida cautioned investors against thinking the Fed would act to halt a sharp market decline during a Bloomberg interview on Dec. 3 exactly two months after Powell’s original comment broke the stock market’s back (click for link). The S&P 500 fell 3.23 percent the next day and the Dow Jones Industrial Average fell nearly 800 points as markets began to reprice a more aggressive Fed. The Dow Jones fell more than 2300 points from the Dec. 3 top heading into the last Federal Open Market Committee (FOMC) policy meeting of 2018 on Dec. 19.
The Fed announced another quarter-point hike in interest rates and lowered its forecast from four to two rate hikes in 2019. Powell’s comments on the Fed balance sheet being reduced by $50B a month in the fourth quarter spooked the markets. If unaltered, the Fed is slated to shrink its balance sheet by $600B in 2019. In the post FOMC press release conference, Powell said the Fed planned to have the balance sheet runoff on “automatic pilot” and to use “rate policy to adjust to incoming data” (click for link).
Markets sold off further, ultimately slipping into bear market territory (a loss greater than 20 percent) before bottoming on Dec. 26. The stock market continued its rally into 2019 and further gains followed when Powell said on Jan. 4 the Fed would be “prepared to adjust policy quickly and flexibly and to use all of our tools to support the economy” (click for link). The following figure of the S&P 500 over the last few months highlights how sensitive the stock market has been to the flip-flopping of Powell’s hawkish, then dovish, then hawkish, then dovish comments.
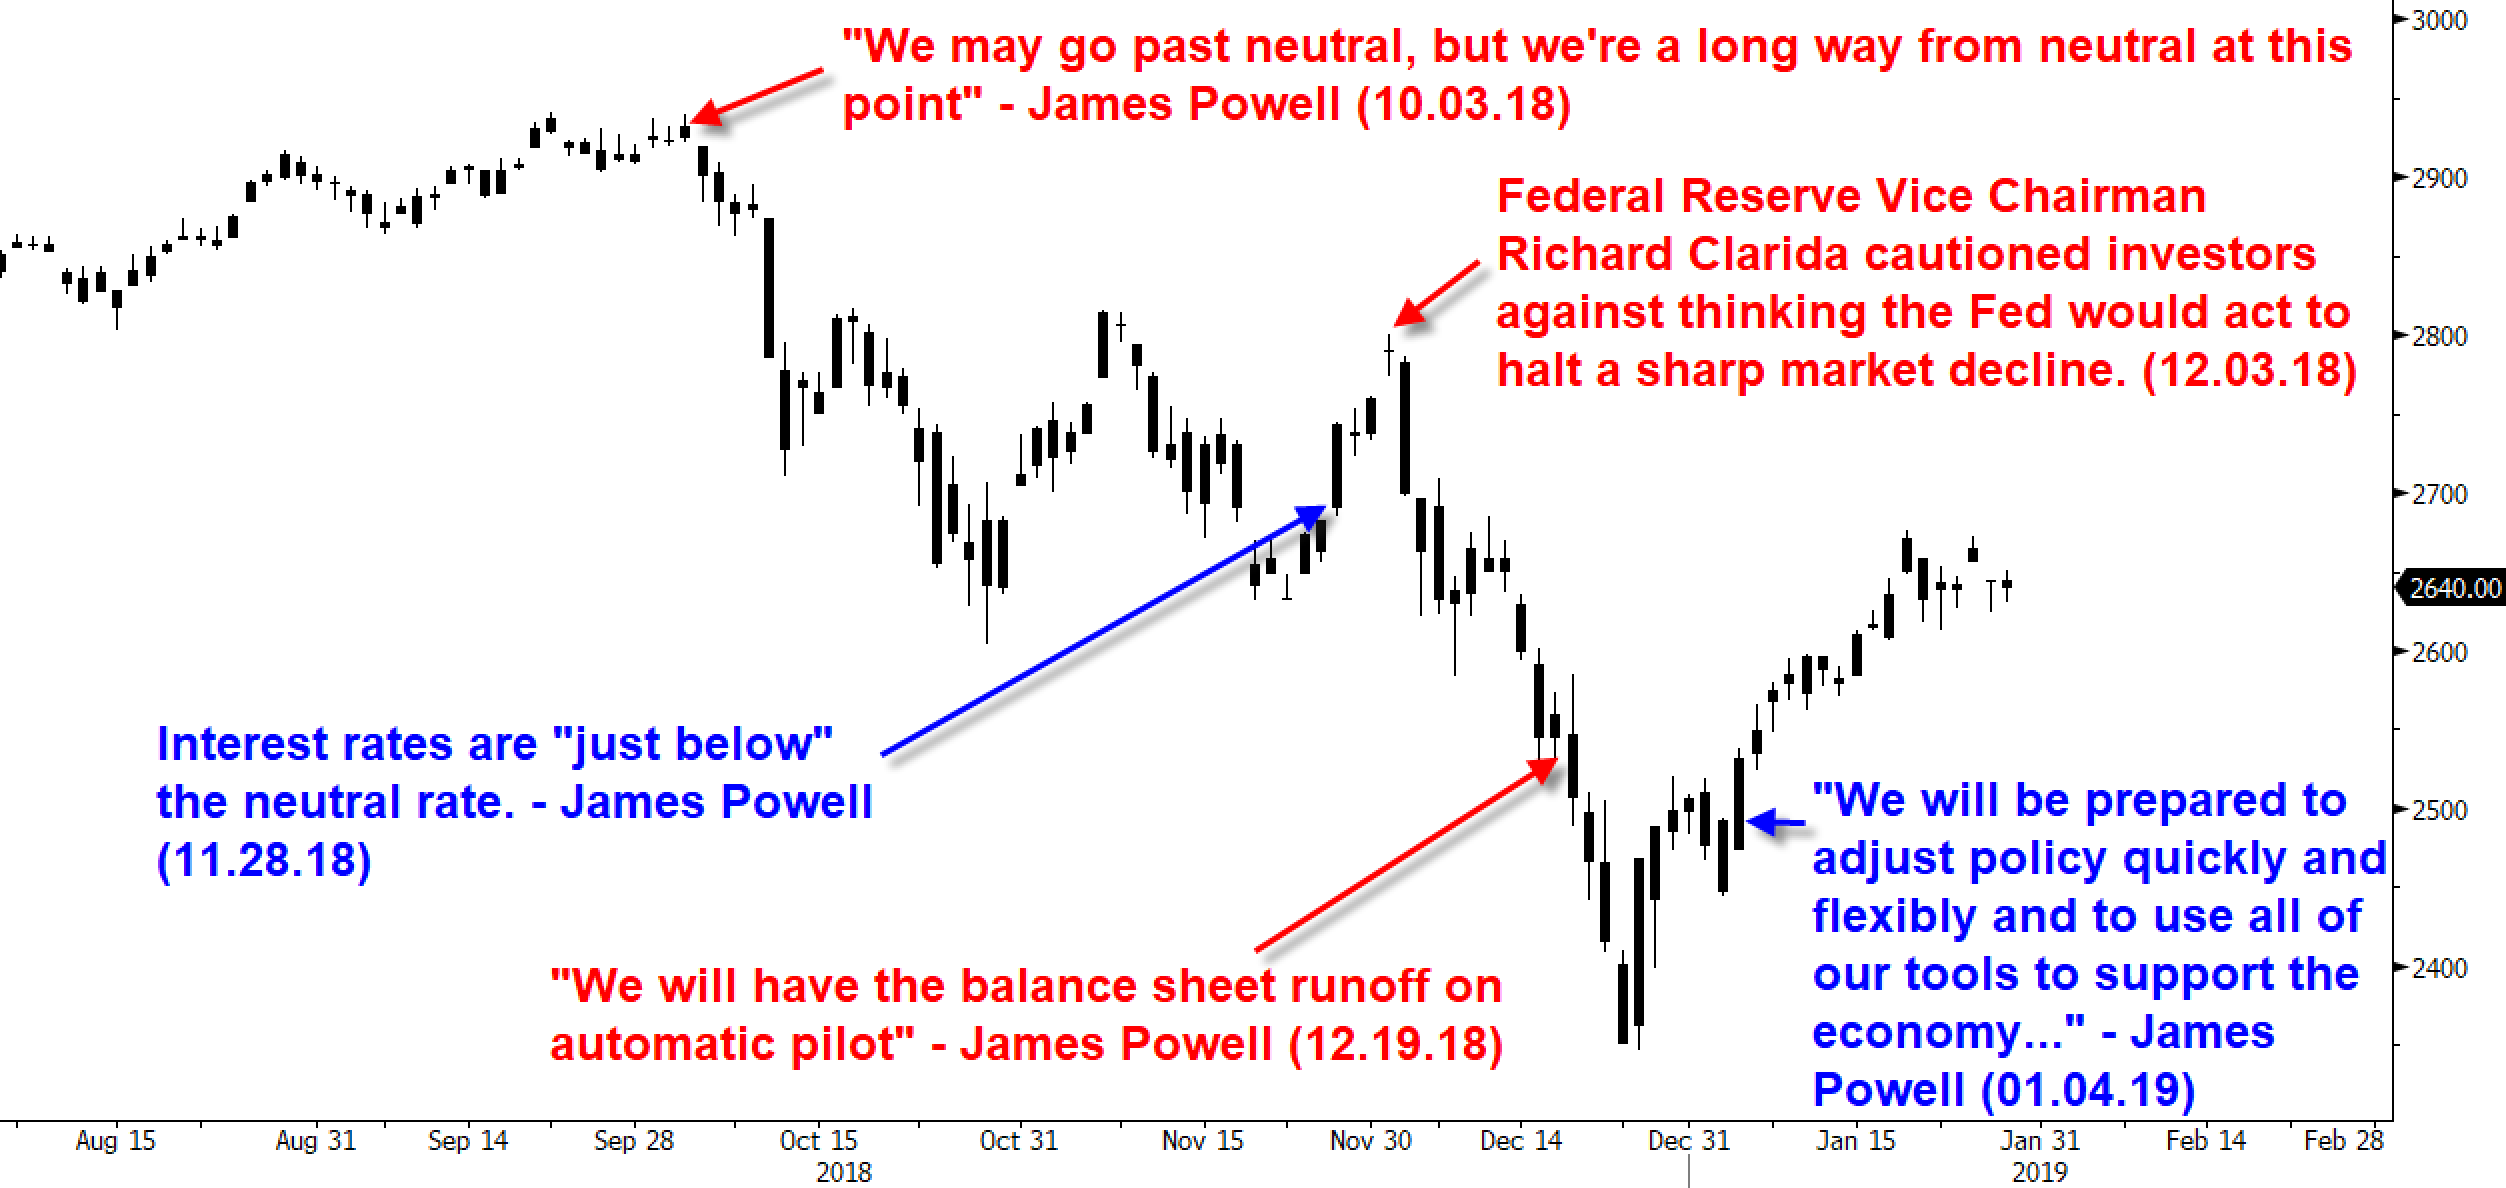
The figure above shows the dramatic swings and bear market decline of the fourth quarter of last year. In retrospect, 2017 and 2018 couldn't have been any more different. As mentioned previously, in 2017 only one percent of global asset classes experienced negative total returns, whereas in 2018, 90 percent of the 70 asset classes tracked by Deutsche Bank posted negative returns through mid-November. According to their data, this represented the largest share of assets under pressure going back to 1901 (see chart below).

All Clear?
Powell seems to have had a change of heart similar to Yellen’s which helped to jumpstart the global recovery during her tenure. Should investors expect a similar outcome ahead? We advise against taking such a sanguine view for several reasons outlined below.
Blindly increasing exposure to risk assets at this point is not like the backdrop in early 2016. U.S. manufacturing activity bottomed in January 2016 and Chinese activity bottomed a month later. Both economies witnessed sharp rebounds throughout 2016 which gave support to global stock markets. The Manufacturing Purchasing Managers Index (PMI) for both the U.S. and China are shown below, highlighting the turn in manufacturing activity in early 2016.
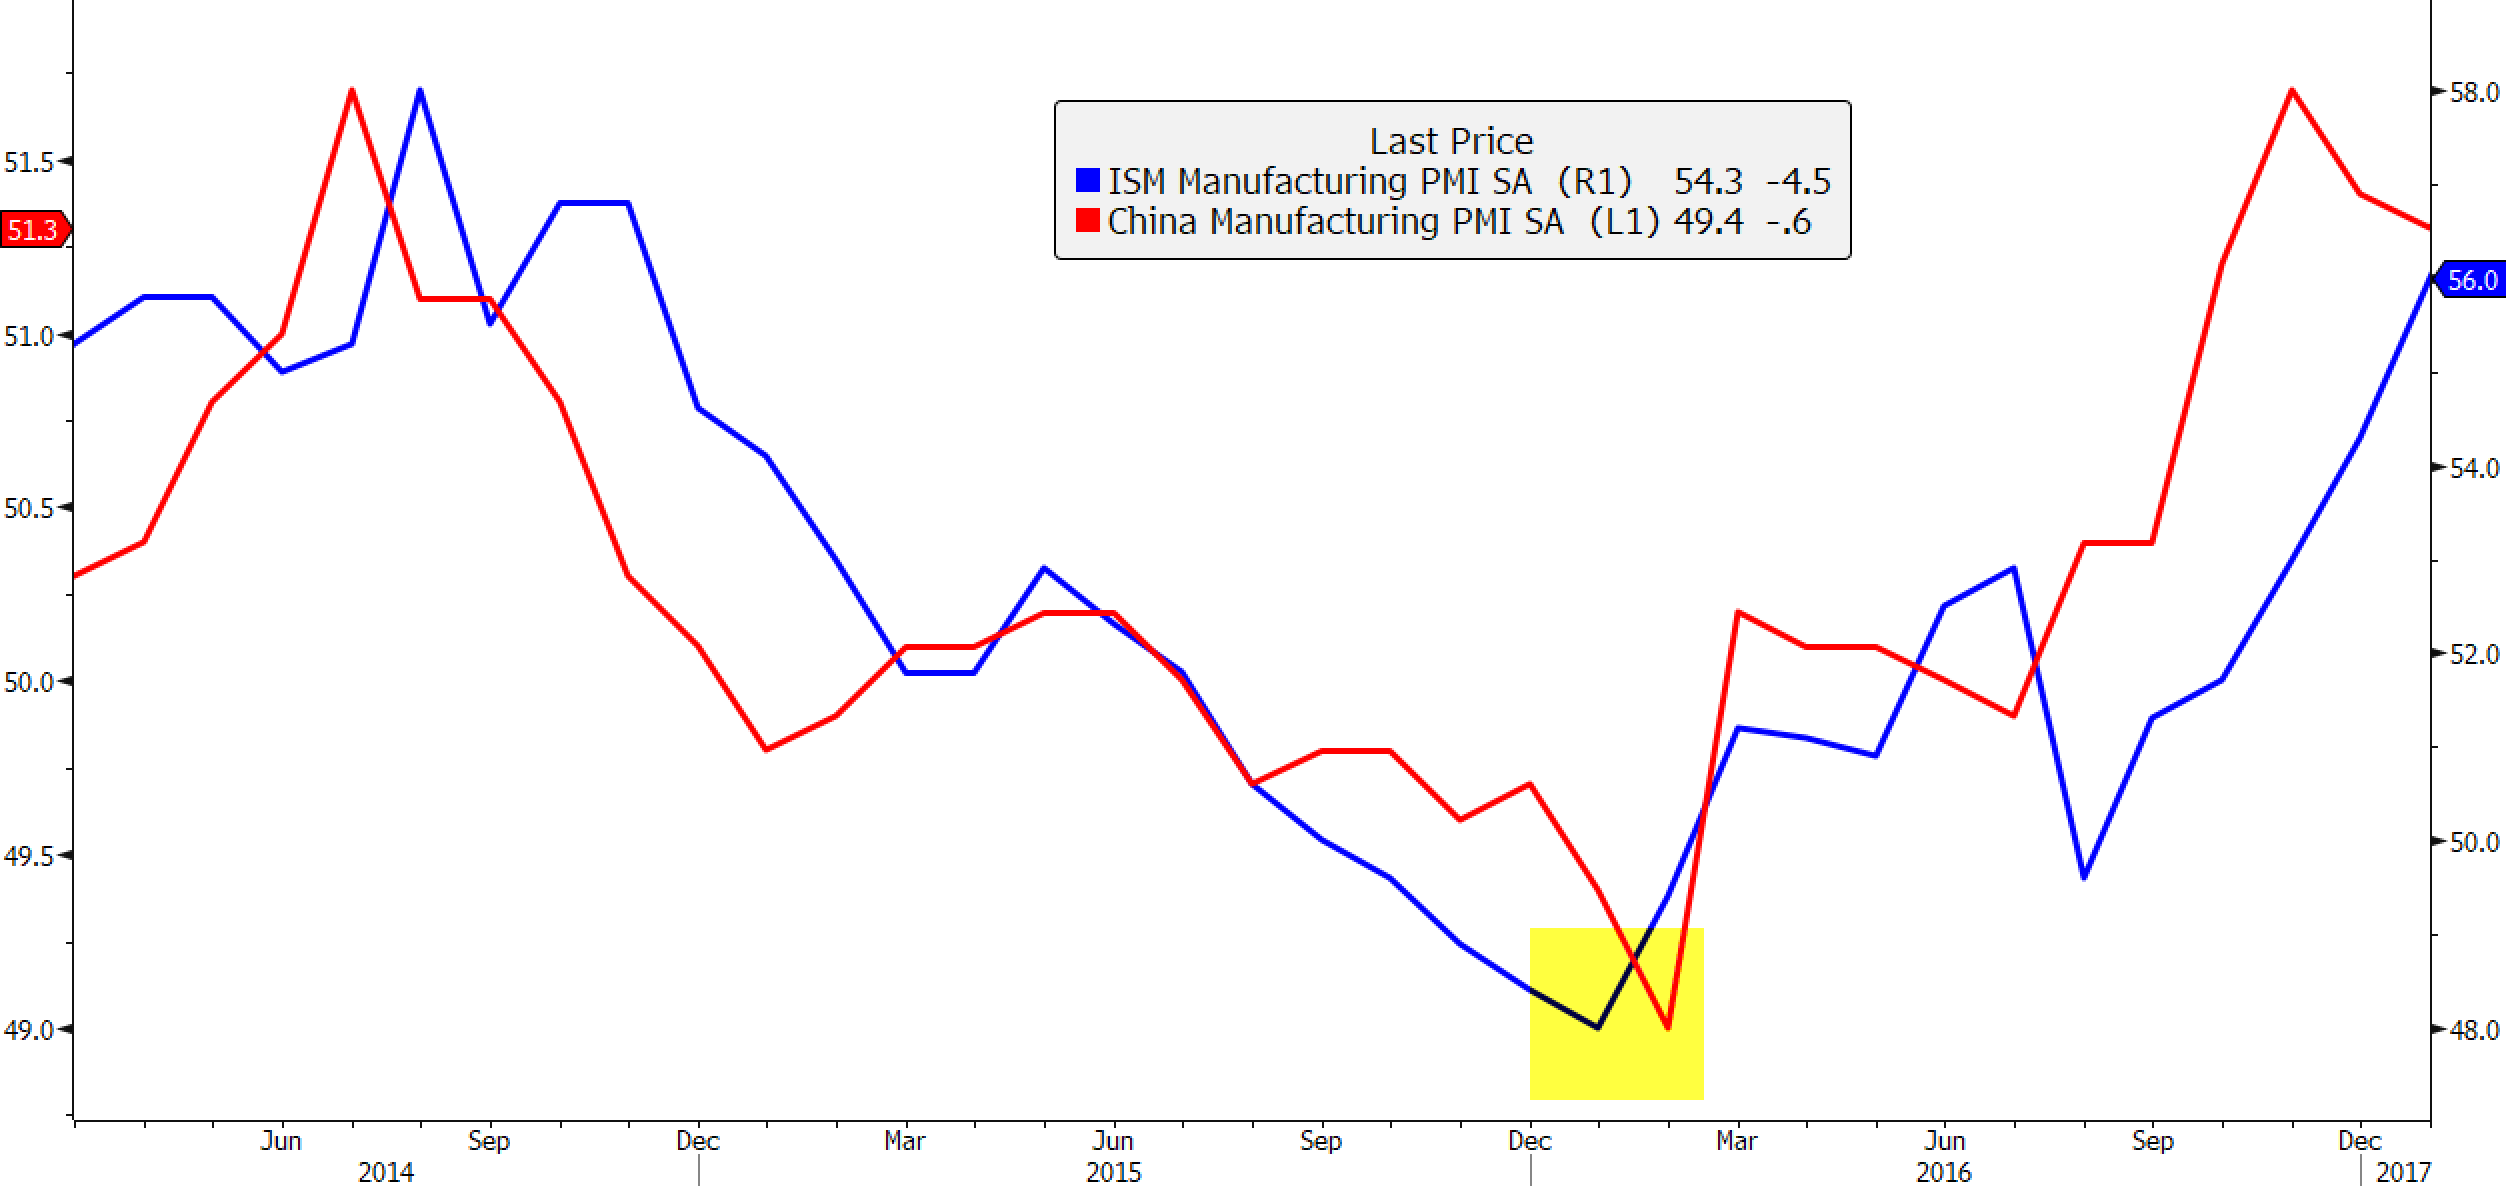
Looking at the current situation there is no sign yet of a turnaround for Chinese manufacturing activity and the slowdown in the U.S. only began a few months ago with likely more to go. Historically, stocks have not made impressive gains against the backdrop of a weakening manufacturing picture, which is why we feel the upside for further investment gains in U.S. equities may be limited at this point.

Our leading economic indicators show growth in the U.S. is likely to continue slowing throughout the first half of 2019. Our firm’s interest rate momentum index leads the Conference Board’s Leading Economic Index (LEI) by one year and suggests the Conference Board’s LEI should fall well into the summer.

The growth picture in China does not indicate a bottom for economic growth. This Monday, Caterpillar Inc. (CAT) posted its largest shortfall in quarterly profits in a decade and said sales of its excavators will be flat year-over-year in China. Global growth warnings also came from FedEx (FDX) who, after reporting earnings on Dec. 18, fell 12 percent on the day due to their less than rosy outlook for 2019. Comments from FedEx’s conference call are provided below (click for link):
“Our international business, especially in Europe, weakened significantly since we last talked with you during our earnings call in September. In addition, China’s economy has weakened due in part to trade disputes.” – CEO Fred Smith
“The peak for global economic growth now appears to be behind us.” – Executive VP Rajesh Subramaniam
Recent economic data coming from China illustrates how pronounced their economy is slowing of late. Chinese retail sales for December showed annual growth of 8.2 percent, the slowest growth seen in 15 years and down significantly from the 13.3 percent average growth rate since 2009. Chinese industrial production growth for December came in at 5.7 percent, just shy of matching the 5.4 percent lows seen during depths of the 2008-2009 global recession. Should January’s production growth fall below 5.4 percent, it would mark a 17-year low for China. The real shocker is that Chinese GDP growth slowed to 6.4 percent by the end of 2018, matching the lows seen in 2009 and any lower would represent the slowest growth rate for China in decades.
China's importance to the global economy cannot be overstated. Its economy is the second largest in the world but is responsible for nearly a third of global growth each year. For many countries, China represents the largest destination for exports, as highlighted in the following figure, which is why stabilization in Chinese growth is critical for its trading partners.

For those interested in reading further on the importance of Chinese growth and potential problems, the following article provides a great summary: “As China’s Economy Slows, Why the World Should Care” (Bloomberg)
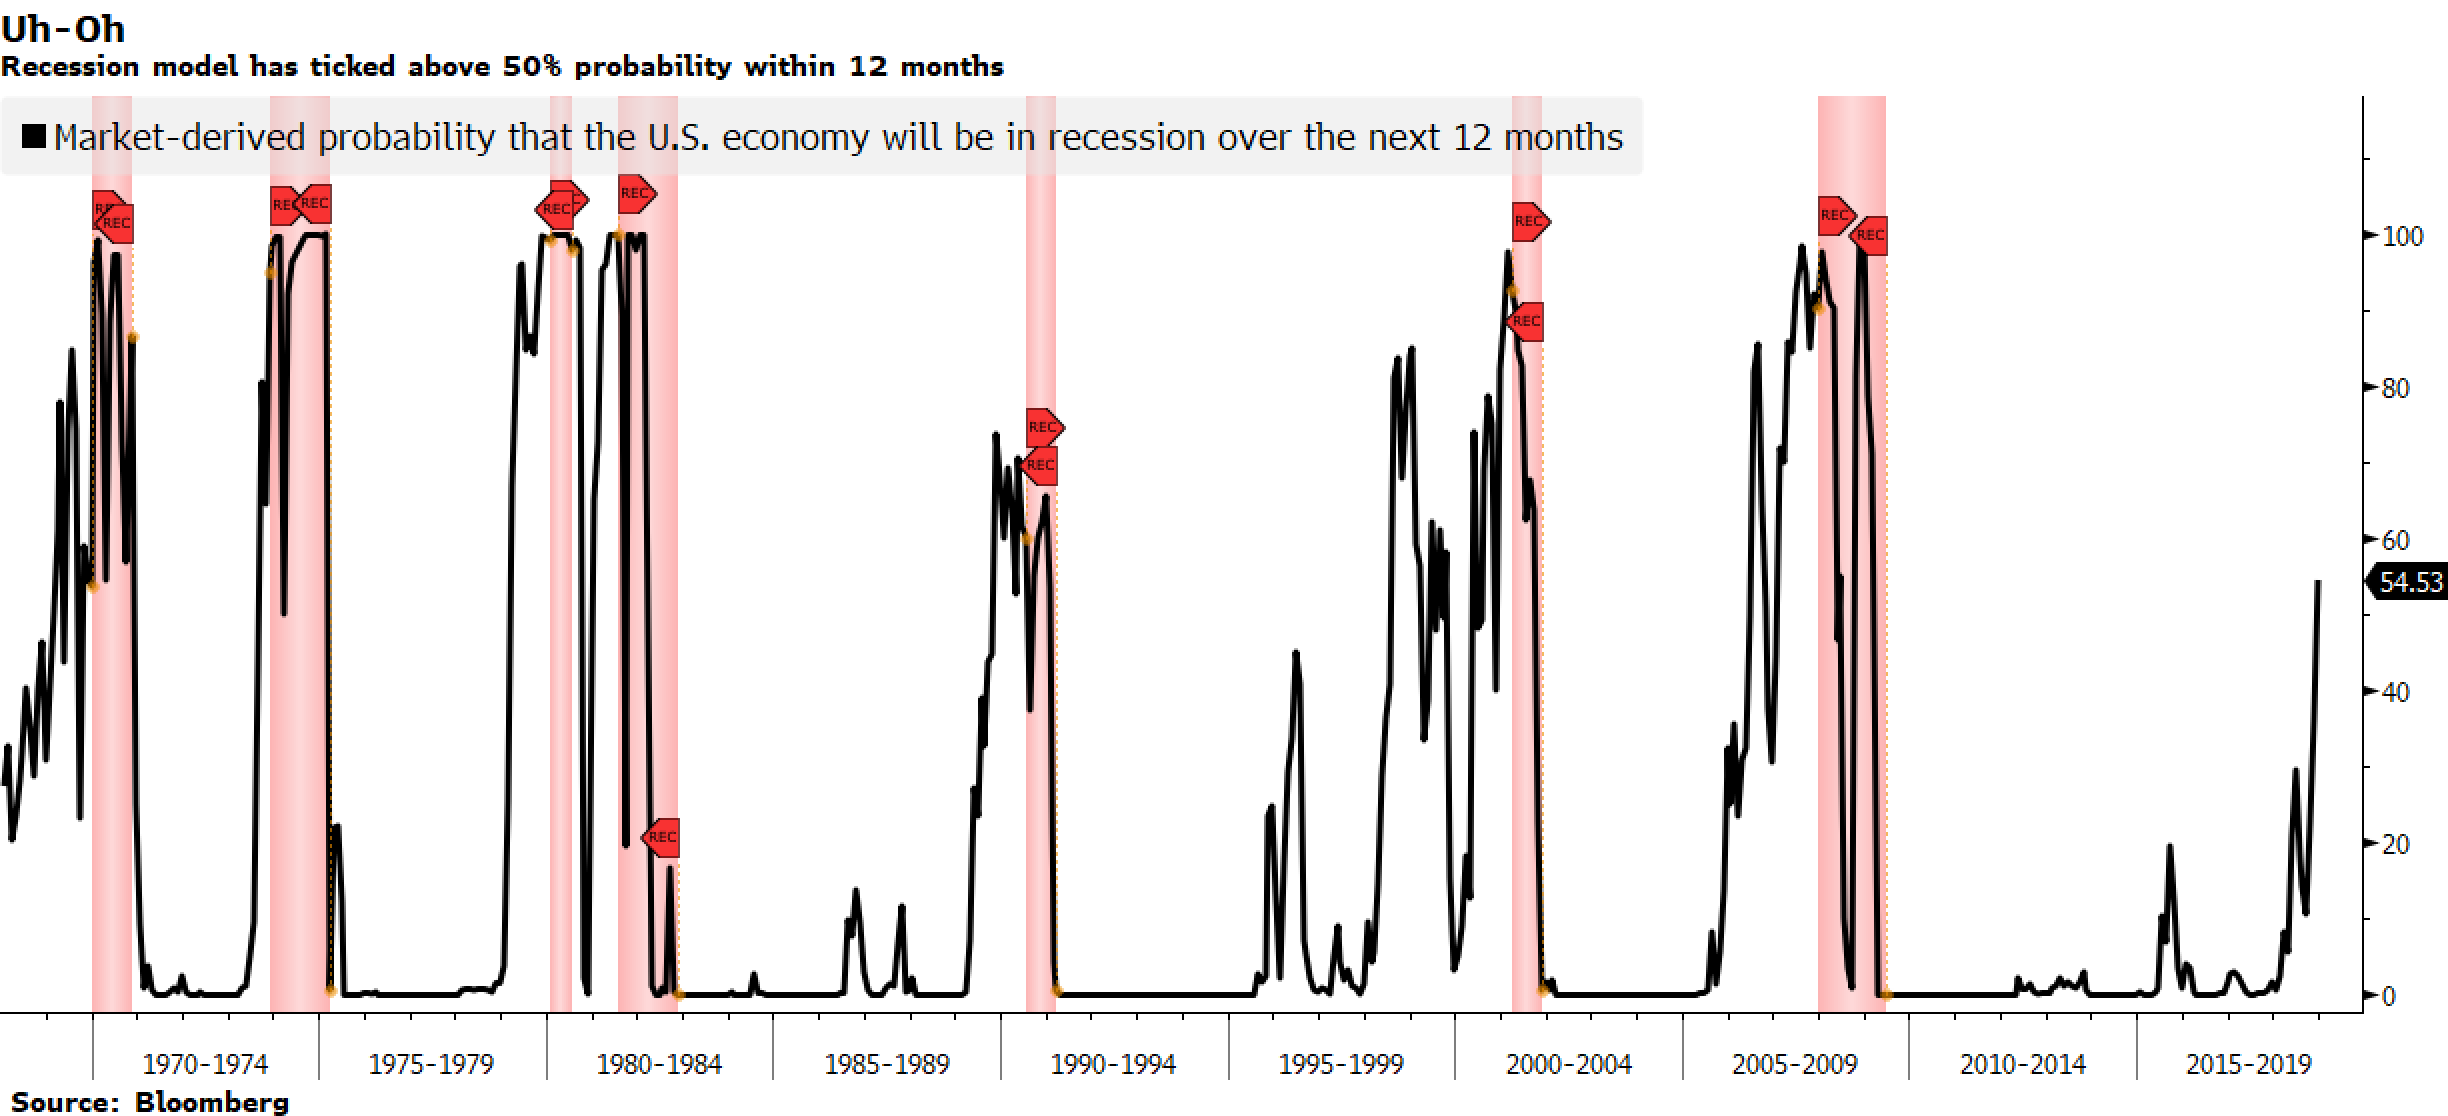
Turning back to the U.S. economy, even if we see near-term economic stabilization in the coming months, a lower exposure to risk assets is warranted given the length of the current expansion and fading supports for the economy. Bloomberg editorialist Cameron Crise created a recession model that forecasts the probability of a recession within 12 months and it recently breached the 50 percent mark and is at its highest level since the last recession. What is perhaps even more concerning is he also forecasts the probability of NOT being in a recession over the next two years and the current reading suggests less than a five percent chance that the U.S. will not be in recession by 2021. Put another way, his model forecasts more than a 95 percent chance of a recession within two years.

When his model reached more than a 50 percent chance of a recession within 12 months, the U.S. economy was in recession 88 percent of the time one year out. His model’s history going back to the late 1960s is shown below, and why the current reading just under 55 percent is concerning.
Get Ready for a Bumpy Ride
Its our opinion at this time to maintain a defensive posture and not chasing the market higher as we believe there are several risks that lay ahead that we perceive outweigh the benefits of buying U.S. stocks at these levels. Given China’s importance to global growth, we are concerned that there appears no imminent sign of an economic turnaround and believe China is likely to decelerate further, which will weigh on global growth and global corporate earnings.
There is another significant situation we will monitor this year which is a potential debt crisis in Italy. This week we learned that Italy is Europe’s first major economy to enter a recession in five years as economic growth contracted in the second half of 2018. Continued economic weakness in Italy will lead to a further expansion in the country’s budget deficit this year as tax revenue are likely to fall below estimates. The Italian government was already on course to expand their deficit spending for 2019-2021 as they recently approved a law decree that introduces minimum universal income and pension reforms that allow citizens to retire at 62 years old (versus 66-67 previously). Ratings agencies Fitch and Moody’s will review their ratings for Italian sovereign debt on Feb. 22 and March 15 respectively, with both agencies currently holding Italy just one notch shy of junk. Should Italian debt be downgraded to junk status, the yield on their debt would likely climb significantly as did Greek debt when it went through its debt crisis between 2010-2012.
A potential downgrade of Italian debt could not have come at a worse time. Italy takes third place on the global debt scene with the most outstanding public debt at $2.3T, which is more than six times the amount of debt Greece has outstanding and would likely have greater implications for the Eurozone and global financial markets should its debt market begin to wobble. There is the potential for a flare-up involving Italian debt this year not only because of their expanding budget deficit but also due to the debt maturity profile for Italy, with nearly 16 percent of all outstanding debt for Italy coming due this year alone. Italy’s debt market will be put to the test this year and things could take a turn for the worse should Italy’s debt rating be downgraded to junk.
Summary
With a less than favorable economic backdrop in which global growth continues to decelerate on the back of the global growth juggernaut, China, potentially decelerating to its slowest economic growth in three decades, we are maintaining a defensive posture. Whenever growth slows, the strain on government finances intensifies and we see the potential for serious trouble arising in the Italian sovereign debt market.
The U.S. is unlikely to be immune to the global growth slowdown as our indicators forecast decelerating U.S. growth throughout the first half of this year and, as highlighted above, recessionary risks for the U.S. continue to build. We believe what caused Powell to indicate the Fed is likely to pause interest rate hikes was a combination of a slowing global economy and weakening U.S. growth. The potential for the U.S. Fed to end its tightening cycle that began years ago will likely lead to a weaker U.S. dollar and lift gold and silver prices higher. We believe gold may warrant a position in investor's portfiolios this year as a hedge against a weaker U.S. dollar as well as a hedge for geopolitical uncertainty. When the world markets suffered from the Greek debt saga in 2011, gold acted as a safe haven and hit nearly $2,000/ounce. We do not anticipate such a sharp move ahead but do believe that an allocation to gold is warranted.
With so many potential headwinds facing investors, we believe taking a defensive posture is warranted. Should the stock market weaken and potentially revisit the December 2018 lows, we will reassess the risk-reward outcomes. Should we see stabilization in global growth at that time it would be appropriate to reassess increasing exposure to risk assets again.
To find out more about Financial Sense® Wealth Management or for a complimentary risk assessment of your portfolio, click here to contact us.
Advisory services offered through Financial Sense® Advisors, Inc., a registered investment adviser. Securities offered through Financial Sense® Securities, Inc., Member FINRA/SIPC. DBA Financial Sense® Wealth Management.


