As we enter the trading day on Friday, we can add China to the list of current concerns (Europe, Korea) impacting the U.S. markets (SPY) According to Bloomberg:
Chinese stocks (FXI) fell for the first time in three days, led by banks and developers after Shanghai Securities News said the government may cut the target for new lending next year.
Chinese policy makers have stepped up measures in recent weeks to curb inflation that reached 4.4 percent last month, the fastest pace in two years. Analysts at nine banks surveyed by Bloomberg News last week predicted the central bank will boost borrowing costs for a second time by the end of the year (Full Story).
We have some elements in place for corrective activity, including fundamental concerns in Europe and high levels of investor optimism. The spring 2010 correction was painful with the S&P 500 falling 16%. If history is any guide, the current correction will most likely fall into the 3% to 5% range, rather than the 8% to 16% range. All corrections are unsettling, but the current situation should not be as gut-wrenching as what transpired between the April 2010 highs and the July 2010 lows. Investors who were patient and rode out corrections in 2009 were rewarded.
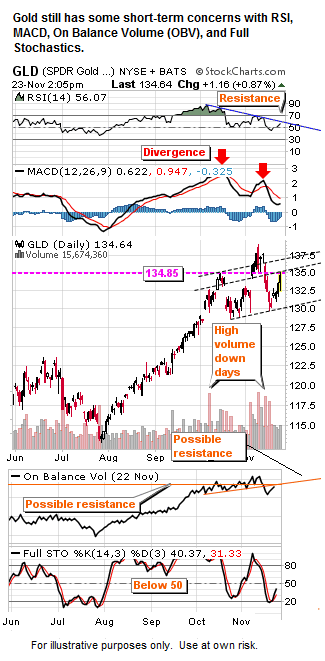
We own gold, like gold, and plan to buy more gold, but the market is telling us to be patient for a while longer in terms of looking for a good risk-reward entry point for GLD (gold ETF). Numerous short-term indicators are still flashing some “be careful” signals.
We have tailwinds coming from Fed policy (see videos & analysis). We also have a market that is in better shape to date relative to where it stood prior to the spring and summer correction. Prior to the spring/summer decline, the weekly chart of the S&P 500 showed significant bearish divergences between MACD and price (left side of chart below). Today’s market has a much better looking weekly MACD relative to price (right side of chart below).
Three to five percent pullbacks are to be expected during any market advance. A 3% drop from the recent closing highs would take us to 1,189 – this has already occurred with the close of 1,178 on November 16th. A 5% pullback would take us to roughly 1,165 on the S&P 500, which is near an area of possible support. A move back to the next logical area of 1,156 would result in a 5.7% correction from the recent highs. A move to 1,144 would be a 6.8% correction. A break below 1,132, especially on a weekly closing basis, would be concerning and would make us much more risk averse (see table for key areas of possible support).
In terms of seasonals, we have entered a favorable period which may provide tailwinds for stocks over the next six to seven months. Obviously, the situation in Europe needs to be monitored closely.


