


By Chris Puplava, 7/25/2018
Note: This quarterly newsletter is longer than normal as we feel financial markets are at a key inflection point and we wanted to articulate our thoughts in detail as well as provide insight into our forward investment strategy and address the weak performance of the PIMCO Income Fund, a widely held asset by our clients.
Over the last year, we have progressively seen global equity markets undergo significant declines from their highs while U.S. markets have remained resilient. This is likely due to the tax stimulus passed last year as well as record corporate buybacks. While seeing more and more equity markets roll over, we can’t help but recall Agatha Christie’s famous murder mystery written in 1939 titled, “And Then There Were None” in which ten guests on a remote island were murdered off one by one. While U.S. equity markets have been able to buck the trend so far, we feel it is only a matter of time before they too roll over and join the global correction that has been underway all year. It has been for this reason that we have positioned client accounts so defensively.
By simply looking at the returns of the S&P 500 in the first half of 2018, one could be forgiven for thinking returns were decent and that markets were uneventful. By the close of the books in June, the S&P 500 managed a price gain of 1.7% or 2.6% including dividends. However, what’s amazing about this is that much of the gains this year both in the S&P 500 and the Nasdaq are due to just three stocks!
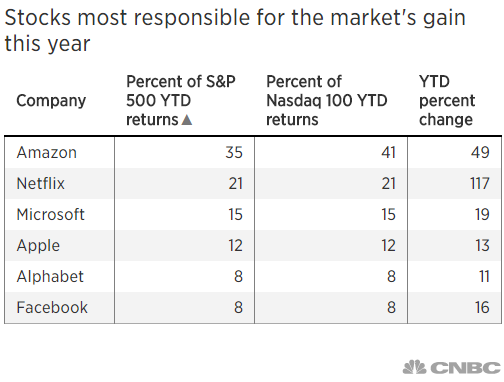
Just three stocks are responsible for most of the market’s gain this year (CNBC)
Amazon, Netflix and Microsoft together this year are responsible for 71 percent of S&P 500 returns and for 78 percent of Nasdaq 100 returns.
The three stocks make up 35 percent, 21 percent and 15 percent of S&P 500 returns, respectively, while making up 41 percent, 21 percent and 15 percent of Nasdaq 100 returns.
Though the above article highlights how only a handful of stocks are holding up the main indices, the other side of the coin is how much pain has been experienced elsewhere. When we look at how stocks have performed over the last year and where they are relative to their 1-year high, things get even more interesting.
As of the close of 07/20/2018, the S&P 500 is 2.5% off its 1-year high formed on 01/26/2018, which makes it appear as if the broad market is more or less at its highs over the past year. However, looking under the surface at each of the 500 members in the S&P 500 shows a radically different picture, illustrated by the table below:

Source: Bloomberg, Financial Sense® Wealth Management. Past performance is no guarantee of future results. All indexes are unmanaged and cannot be invested into directly
The discrepancy between the S&P 500’s return relative to its 500 members is due to the outsized weights that large technology companies have relative to their peers. When looking at the collective market capitalization of the S&P 500 and its members’ relative size, you can see how outsized returns by technology stocks can have outsized return impacts on indexes like the S&P 500. For instance, the top 5 largest companies in the S&P 500 have a market capitalization of over trillion dollars, equal to the bottom 282 sized companies of the S&P 500—absolutely staggering!
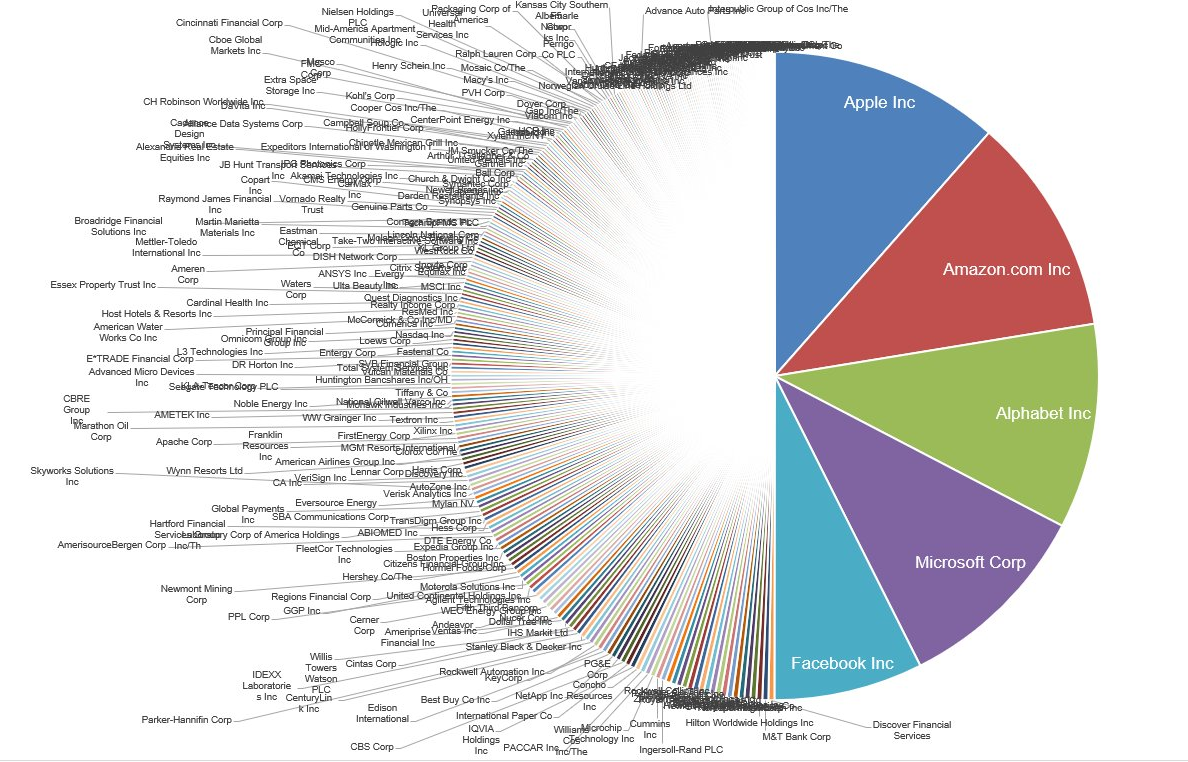
Source: Michael Batnick
Looking beyond the US equity border, things become even darker, particularly in emerging markets. When looking at major asset class benchmarks for the first six months of the year, we can readily see how challenging this year has been so far. For example, emerging market equities were down 7.7% while developed market equities outside of the U.S. were down 4.5% and there was no place to hide in the bond market. Long-term U.S. Treasuries were down over 4%, U.S. investment-grade corporate bonds were down nearly 6% and large losses were sustained in emerging market debt, which was down 8%.
Commodities were a mixed bag in the first half, though this was not the case on the currency front as nearly every major currency fell relative to the US Dollar, some rather dramatically. The Argentine Peso fell over 35% while other large losses were seen in the Turkish Lira (- 17.3%), the Brazilian Real (- 14.7%), and South African Rand (-9.8%). As seen below, outside of U.S. equities (particularly anything with an emphasis in technology stocks), there was a lot more red than green in the first half of the year.

Source: Bloomberg, Financial Sense® Wealth Management. Past performance is no guarantee of future results. All indexes are unmanaged and cannot be invested into directly
Foreign Market Weakness – You Go, I Go
During the present bull market in stocks, we have experienced several harsh corrective periods in U.S. equities involving double-digit losses over a span of several months. What was interesting about all these corrective periods were that U.S. stocks were able to buck the trend while foreign markets were selling off…until they weren’t! Foreign market weakness has been the canary in the coal mine for every major selloff in U.S. equities during this bull market. This is shown below in which foreign stock markets (red line) sold off first while U.S. equities (S&P 500, shown in black below) continued to climb or at worst traded sideways (yellow region below). Eventually, U.S. markets were not able to ignore the deterioration seen globally and finally corrected as well in which both foreign and U.S. stocks sold off (the red shaded region below).
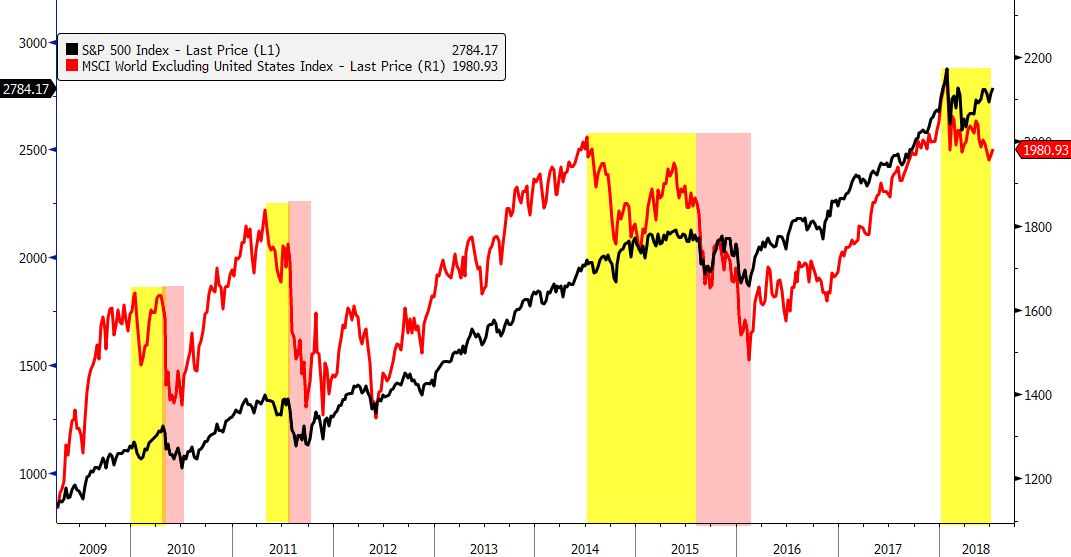
Source: Bloomberg, Financial Sense® Wealth Management. Past performance is no guarantee of future results. All indexes are unmanaged and cannot be invested into directly
Canaries in the Coal Mine?
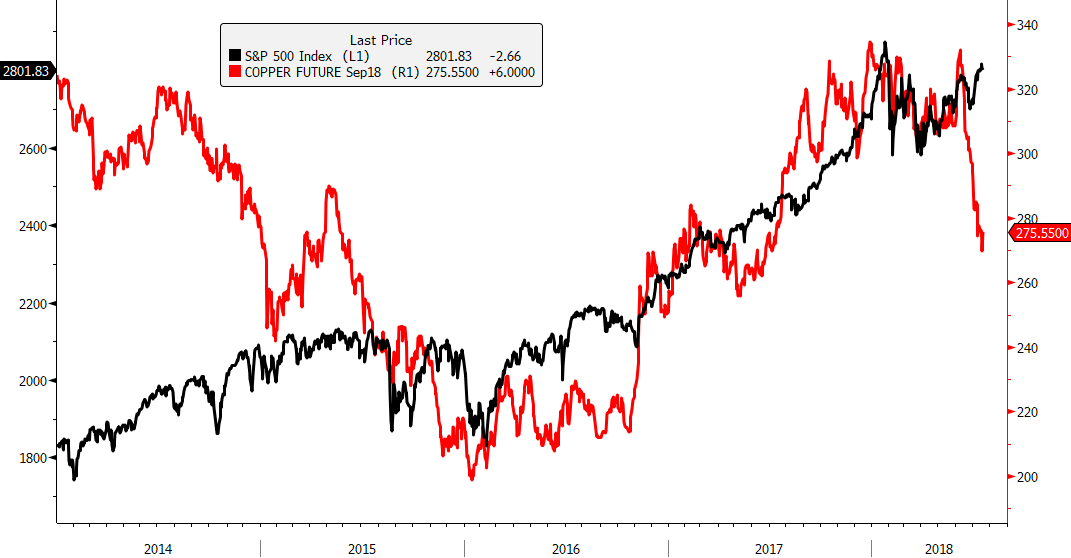
Our list of concerns for U.S. equities is growing and we feel that the stock market can turn a blind eye for only so long. In addition to the warning being flashed by foreign stock markets highlighted above, we currently are seeing a sizable decline in copper prices. Given copper’s price sensitivity to global growth, it has earned the name “Dr. Copper” as it has been jokingly said copper has a Ph.D. in economics due to its reliability in providing insights on the global economy.
With this in mind, copper sent a warning message when it began to decline in 2014 and even more so in 2015, well before U.S. stock markets began to stumble. We are seeing yet another significant price decline in copper prices to their lowest levels in the last year (red line below).
Source: Bloomberg, Financial Sense® Wealth Management. Past performance is no guarantee of future results. All indexes are unmanaged and cannot be invested into directly
Given China’s importance to global economic growth, we always need to keep an eye on China and the message from the Chinese currency also likely spells trouble ahead. China’s economy began to slow down in 2014 which contributed to a global economic slowdown and with a weakening economy came a weaker currency. To try and slow the decline of its currency, China sold off its foreign exchange reserves to buy its own currency to support its price, eventually using nearly 25% of their trillion in foreign exchange reserves in the effort. Several times the global financial forces that were pushing the Chinese currency down were too strong for the Chinese central bank to hold at bay that they devalued their currency to bring its price more into equilibrium with the market. It was the first devaluation of the Chinese currency in August 2015 that sent global financial markets reeling where the S&P fell more than 10% in just three short days and ultimately fell 15.2% from its 2015 highs to its 2016 lows. While the S&P 500 began to recover in 2016, it wasn’t until the Chinese currency bottomed late in 2016 that the markets finally began to take off and it’s likely no mere coincidence that the S&P 500 and the Chinese currency peaked within two weeks of each other this year.
Thus, investors should be very alarmed by the massive slide in the Chinese currency (red line below) in which the currency in the last two months (the yellow shaded region below) has had double the decline seen back in August 2015 (red shaded region) and yet U.S. equity markets haven’t even flinched.

Source: Bloomberg, Financial Sense® Wealth Management. Past performance is no guarantee of future results. All indexes are unmanaged and cannot be invested into directly
Update on Q2 Newsletter
The big theme from the Q2 newsletter we sent out in April was that we were likely entering our third slowdown since the economic expansion began in 2009. The most important chart of that letter is shown below where we highlighted prior slowdowns and suggested a possible top in the Conference Board’s U.S. Leading Economic Index (LEI).

Source: Bloomberg, Financial Sense® Wealth Management
Looking at an updated version of the chart above, it does appear as though April may have been the peak, which, though not alarming turn of events as of right now, is something we need to be mindful of heading into 2019, especially if we follow the path shown below.

Source: Bloomberg, Financial Sense® Wealth Management
Our firm’s proprietary LEI, which leads the Conference Board’s, was one reason for our call. It peaked in October of 2017 and, assuming the downtrend persists, is why we feel the economic growth slowdown may present a headwind going forward.

Source: Bloomberg, Financial Sense® Wealth Management
Defense Wins Championships
Given the above, in addition to the harbingers of an unfolding global economic slowdown, we have maintained a defensive posture of elevated cash and bonds for most of this year. While we do expect market weakness ahead as U.S. economic growth slows, we believe that it will be a buying opportunity rather than the start of a bear market. History has shown that the major bear markets of the last century have been associated with recessions. Absent a recession, when markets undergo significant declines, stocks typically recover and reach new highs within a year, with the 1987 crash being the longest example. Examples of when markets fall significantly and yet hit new highs when there was no ensuing recession are provided below:
- 1987 Stock Market Crash
- S&P 500 decline = 35.94%
- Time to hit new high = ~ 2 years
- 1998 Collapse of LTCM & Russian Rubble Collapse
- S&P 500 decline = 21.69%
- Time to hit new high = 4 months
- 2011 US Debt Downgrade & European Crisis
- S&P 500 decline = 21.58%
- Time to hit new high = 8 months
Source: Bloomberg, Financial Sense® Wealth Management. Past performance is no guarantee of future results. All indexes are unmanaged and cannot be invested into directly
It is exceptionally rare that the U.S. economy slips into a recession prior to the Federal Reserve ending a rate raising cycle and we simply see little evidence of a recession on the horizon as our proprietary recession model pegs the odds of a recession within a 1-year horizon at only 5% (recessions highlighted by red regions).
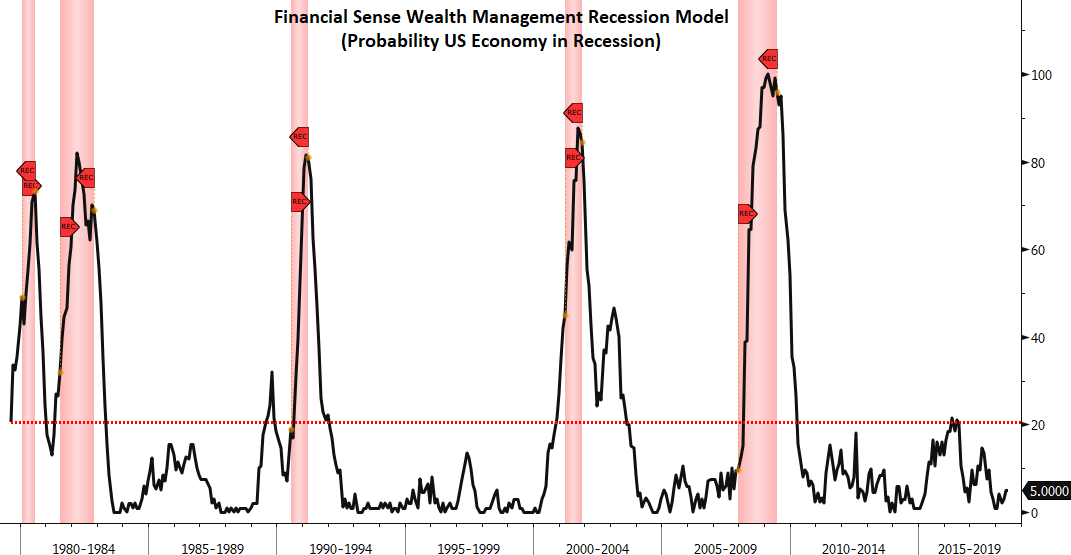
Source: Bloomberg, Financial Sense® Wealth Management
The progression of the typical business cycle in the latter stages unfolds with the Federal Reserve ending its rate-raising cycle as it sees visible signs of the economy beginning to cool off. When this happens, short-term interest rates in the U.S. slow their ascent while foreign interest rates continue to rise as the U.S. typically leads the global economy. As foreign interest rates rise, it makes the US dollar less attractive to foreign currencies and leads to weakness in the USD relative to global currencies. A falling USD is typically associated with rising commodity prices and outperformance by commodity-centric stocks as well as international equities.
For this reason, we are likely to redeploy cash and some of our short-term bond allocations into commodity-related investments as well as foreign equities when we feel the markets have stabilized after a corrective period. These assets often display their strongest returns near the end of a bull market and is why clients are likely to see a greater emphasis in these areas in the months ahead.
Forward Strategy & Comments on the Bond Funds
As highlighted in the table near the beginning of our newsletter showing first half returns for various asset classes, the bond market has suffered across the fixed income spectrum with the significant rise in interest rates, which has impacted client investments in this asset class. Over a year ago when short-term interest rates were below 0.50%, we began to invest in actively managed bond funds that had great performance records in rising and falling interest rate environments and possessed solid income yields.
While we are not thrilled with the performance of the bond funds during the year, they have still performed very well in a difficult environment. The bond funds we have used have total returns in the first six months of the year that beat the Barclays US Aggregate Index’s return of -1.62%, the most widely cited bond benchmark. Some of our bond funds not only beat their benchmarks but some also beat the Dow Jones Industrial Average’s total return of -0.73% by a slim margin in the first half of the year.
With the significant rise in short-term interest rates over the last year, there are now viable yield alternatives to the bond funds we have used and why we will be looking to exit the funds in the coming months. We do not want to exit the fund just yet given our expectations for the U.S. economy to slow in the coming months. Typically, interest rates follow economic growth and inflation rates, with a slowing economy often associated with falling interest rates. Thus, should interest rates fall alongside slowing economic growth our bond funds are likely to rally from here and we would want to sell at higher prices.
Thereafter, we are likely to use a barbell approach (emphasis on two key areas) in both our bond and equity allocation. In terms of equities, we already highlighted our desire to move later in the year towards anti-USD plays such as commodity-related investments and foreign stocks, which are higher on the stock risk scale. While these areas carry higher risk (often measured by volatility), we believe investors will be compensated for this risk with potentially higher returns associated with the later stage of the business cycle. For the defensive portion of the equity barbell strategy, we will be looking at deep value and high dividend yield plays that have been shunned by investors seeking the high returns in technology stocks.
In regards to the bond side of the portfolios, we will be allocating to short-term debt instruments like US T-Bills and money market funds on the defensive side of the ledger where income yields range between 1.5% - 2.25%. On the opposite side of the spectrum, for greater yield, we will be utilizing floating-rate bonds that typically pay a spread on top of short-term rates and reset quarterly. Many of the floating rate bonds we have purchased have seen a significant increase in their yields over the last year with annualized yields ranging from the low 4% to middle 6% range. Our plan is to hold our floating rate bonds until we see risk that the Federal Reserve may lower interest rates to stave off a potential recession.
Summary
Returns in the first half of 2018 were negative for most global financial assets, though returns in the U.S. (on the surface) were decent, largely due to the outsized impacts of technology and consumer stocks. While reviewing international markets and leading economic indicators (LEIs), we do see headwinds at present and is why accounts remain in a defensive posture. Should our concerns for a deeper correction in U.S. markets transpire in the weeks and months ahead, we will be utilizing the weakness as a buying opportunity to reposition accounts for growth. However, should global markets stabilize and U.S. markets escape a correction, we will also begin to redeploy client capital once the all-clear sign has been given. If you would like to discuss our strategy or review your account(s), please contact your wealth manager and we will be happy to speak with you.