


You may have seen that the recent revision to second quarter 2014 GDP came in at 4.2%. This is the third largest quarter over quarter growth rate number in the current economic cycle. Of course we need to remember this follows on the heels of a 2.1% contraction in the first quarter. If we average the entire first half of the year, we are looking at roughly 2% GDP growth, very consistent with the historically subdued growth we have seen throughout the 2009 to date economic recovery. Preliminary estimates for third quarter growth are currently in the low 2% range. So, for now, the character of the current recovery cycle remains as one of the slowest growth environments we have seen in a half century at least. Interestingly, none of the other major developed economies (like Japan and Europe) are growing as fast as the U.S. The key issue globally is that final demand remains weak.
You are probably also aware that the U.S. Federal Reserve has announced that October of this year is the target month for the cessation of their for now half decade long quantitative easing program. Starting in late 2008, the Federal Reserve began balance sheet expansion (printing money) that has witnessed an increase of close to $4 trillion in total value. There is no precedent for this anywhere in U.S. history. Is the Fed now satisfied that the U.S. economy no longer needs emergency or extraordinary monetary stimulus? Have labor markets recovered to their satisfaction? Is the U.S. economy now “back to normal?”
When the Fed first started their quantitative easing program, their intentions were clear. They professed to believe in what has been called the “wealth effect”. The concept being that if the value of housing and stocks went meaningfully higher, households would “feel” wealthier and would go out and spend money. Even better would be if households felt confident enough to borrow and spend. Given that the U.S. economy is 70% driven by consumption, the hoped for cause and effect was that feeling wealthier would engender an increase in consumption, ultimately driving higher GDP outcomes. $4 trillion dollars later and now into a five year QE program, the actual numbers tell us the “wealth effect” never materialized broadly, despite financial and real estate asset price appreciation of magnitude. The Fed is not suspending QE because it has been a raving success, quite the opposite. We personally believe they are calling it quits as they understand their actions have in good part distorted financial asset prices relative to the trajectory of the real economy. Let’s look at the evidence in the numbers as to why QE is ending. More importantly, what now become key economic watch points ahead?
The data is crystal clear in showing us the “wealth effect” has been anything but effectual. The chart below shows us the year over year change in U.S. personal consumption expenditures with an overlay that is the year over year change in household net worth. The disconnect between the two in the current cycle after such tight correlation historically is not only apparent, but unprecedented. In the current cycle we have witnessed the slowest annual change in consumption in any cycle on record. As we all know, from the S&P lows in 2011, we’re up close to 80% in price. In like manner, U.S. real estate prices have marched higher, likewise boosting the rate of change in household net worth. Shouldn’t households “feel” a lot wealthier? Yet the annual rate of growth in personal consumption has not budged since that time. All of the household “wealth generation” has not been able to move the consumption needle in any type of meaningful fashion at all. The perhaps delicious irony? The data below is directly from the Fed itself. With the announced termination of QE for now, it seems the Fed is more than well aware of the real numbers.
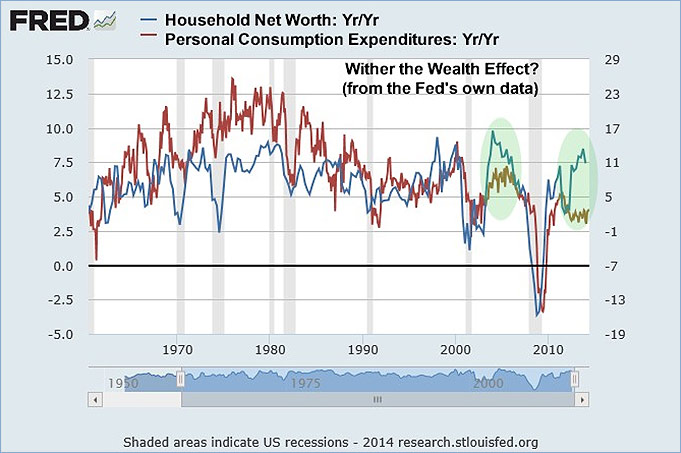
In one sense, is this perhaps the key ugly little secret of the current cycle? If we reduce down the history of this data a bit to the last decade and a half, you can clearly see the dichotomy in relative growth rates between net worth and consumption. In the 2001-2007 economic cycle, the bubble in residential housing prices dragged household net worth higher. Consumption followed along in a much more meaningful fashion than has been the case in the current cycle due directly to home equity lines of credit fueling consumption. The dichotomy between these data points in the current cycle shows us clearly that the wealth effect has been a mere ghost the Fed has been chasing. The race is now over.

Why hasn’t the “wealth effect” worked for the Fed, what data points of importance now become key watch points, and what happens to the financial markets in the absence of a Fed sponsored QE-fueled environment?
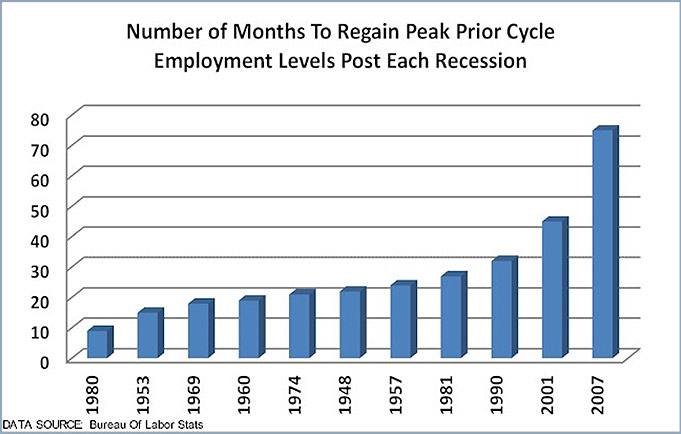
Right to the point, we believe the reality of the real economy has trumped the supposed positive benefits of QE in the current cycle. In other words, the real economy has overpowered Fed intervention. One of the most important character points of the current economic cycle has been the very weak recovery in the domestic labor market. The chart below says it all. We are looking at the number of months it has taken post each U.S. recession of the last sixty years to regain peak employment levels of the prior growth cycle. Never has it taken six years to eclipse prior cycle peak employment as it has in the current cycle. The last three direct post-recession environments have shown us increasing deterioration of magnitude in domestic labor market conditions.
What this historically extreme weakness in labor recovery has precipitated is the most subdued wage recovery cycle accompanying any U.S. economic cycle of the last half century. The top clip of the chart below says it all.
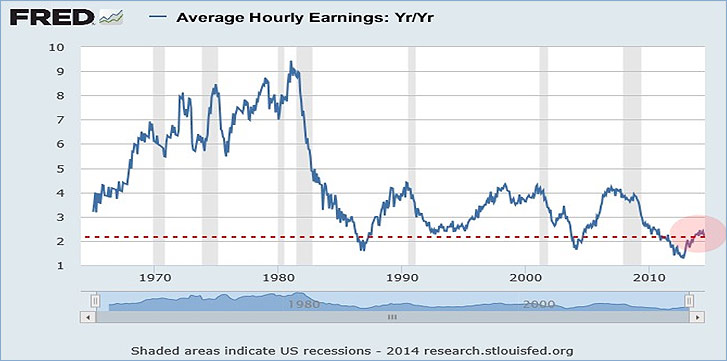
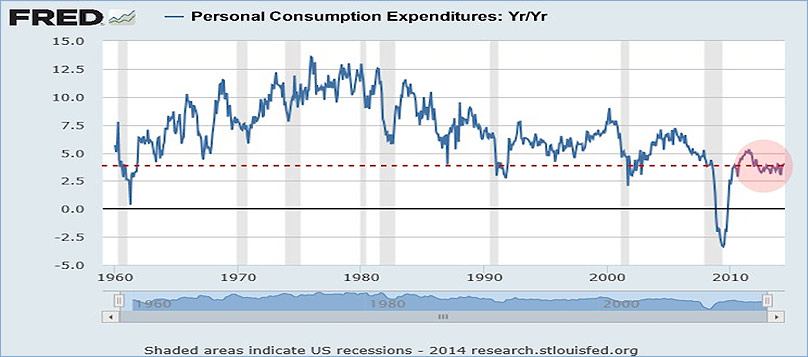
Of course, critical to the character of the current recovery cycle is what subdued wage growth has meant for consumption. The bottom clip of the above chart depicts the year over year change in personal consumption expenditures in the U.S. Like so many other key macro-economic data points, we’re looking at the most tepid recovery in a half century at least. The directional correlation between wage and spending growth is unmistakable in the above relationship. Again, this simply highlights and corroborates the point that the key macro for this cycle is subdued final demand. All the chatter from the Fed about interest rate levels, forward guidance, tapering, etc. is largely noise. In a consumption driven economy, we know the key issue for the reality of the economy. Wage growth is the accelerant of consumption growth, not rising equity and real estate prices. The Fed can print money, but it cannot control where that money finds a home. In the current cycle, it has found a home in financial and real estate assets. There’s just one destination it has missed — the real economy! An absolutely key watch point ahead will be U.S. wage growth and its corresponding impact on consumption.
What about the fate of the financial markets in a QE vacant environment? For those of you watching recent market history, you know that when the Fed ended QE numbers one and two, the stock market fell 10 and 20% respectively. No more money printing, no more rising prices. Not a lot of fun. So far, although investors are fully aware of the QE 3 cessation deadline and should be aware that QE has not accomplished its primary mission, the financial markets have been ascending to very modest new highs. To suggest we find ourselves in uncharted territory is an understatement. Fed policy focusing on the wealth effect as an economic driver/accelerant has been for naught up to this point.
But although the Fed is backing off of QE, not so for the central banks of Japan, China, and Europe. In fact, the European Central Bank is considering embarking on a $1 trillion QE-ish type of plan. The Bank of Japan is going for broke (pun partially intended) and China finds itself between a further monetary stimulus rock and a sharp economic contraction hard place. Global central bank QE/stimulus is clearly picking up where the Fed is leaving off, and for now that is a positive for financial markets.
Not only do we find ourselves in a world awash in liquidity, but we are in the midst of one of the greatest movements of global capital seen in our lifetimes. The primary beneficiary of that movement up to this point has been the U.S. and dollar denominated markets, necessarily inclusive of financial assets. Chinese capital is escaping the crackdown on corruption, Japanese capital is escaping meaningful currency debasement, and finally Euro capital is escaping banking system confiscation (negative interest rate policy), taxes and a softening Euro currency.
For now the deepest and broadest of global capital markets (the U.S.) is the recipient due to the very simple fact that the magnitude of global capital on the move has no choice except to gravitate toward where it can be accommodated/invested. Hopefully it is crystal clear throughout this discussion that both the liquidity created by the central banks as well as the bulk of global capital now “on the move” is not destined for real economic investment. For now, this is supportive of financial assets prices. As you already know, this set of central bank and global capital movement circumstances will not last forever. It is simply a matter of short-term cause and effect for now. If we can identify the correct drivers of real economies and financial markets, we can manage portfolio risk effectively across market cycles by monitoring and responding to change in these key data points.


