Yesterday, a client forwarded us a copy of a chart from an article, Stocks Remain Poised For A Steep Decline. They asked for our interpretation of an ominous looking chart showing a negative divergence between the S&P 500 and the Summation Index. Related to the chart, we respectfully point out that having market breadth, as measured by the Summation Index, diverge from the stock market is not necessarily a red flag of an impending “steep decline”. In addition to market breadth, below we touch on the Fed, potential resistance, and sentiment in relation to our strategy with gold mining stocks (GDX), energy (XLE), materials (XLB), emerging markets (EEM), and the broad market (VTI).
There are numerous reasons to be concerned about a correction in the present day, including unrest in the Middle East, rising commodity prices, stubbornly high unemployment, a vast shadow inventory of homes on the balance sheets of banks, and excess debt in developed nations, but we are not losing sleep because of a divergence between the Summation Index and the S&P 500 Index, despite it being cited as a piece of evidence forecasting an impending “steep decline” in stocks.
Before we get to the Summation Index divergence, there are two short-term developments, one Fed-related and one technical, that may directly impact our current strategy of (a) being patient with cash, and (b) happy holding our current positions. According to Bloomberg this morning:
Two Federal Reserve Bank presidents skeptical about the Fed’s $600 billion bond-buying program said the prospect of accelerating inflation underscores the risk from a record increase in the central bank’s balance sheet.
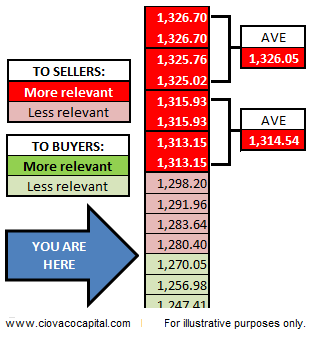
These comments may offset the comments made Tuesday by the Atlanta Fed president (more below). Technically, on January 7, 2011, we presented a table that listed 1,315.93 and 1,325.02 as potentially important levels in the minds of market participants; a portion of the table is shown below.
Table as of 01/07/2011:
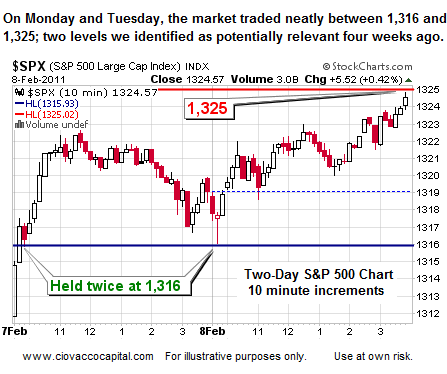
As hypothesized in early January, market participants viewed 1,316 and 1,325 as important levels on Monday and Tuesday of this week. The market held twice at 1,316 (see blue line in chart below) and Tuesday’s high was just under 1,325 (see red line). How important these levels are from a longer-term perspective remains to be seen. A clear break of 1,325 – 1,326 would be bullish for the short-term; it would become more meaningful if we get a weekly close above that level. Not considering other factors, a break of 1,326 on a weekly basis would make us more inclined to invest some additional cash into a few areas including energy (XLE). A sharp pullback from 1,325ish, would make us more inclined to raise some cash from weaker positions, such as emerging markets (EEM).
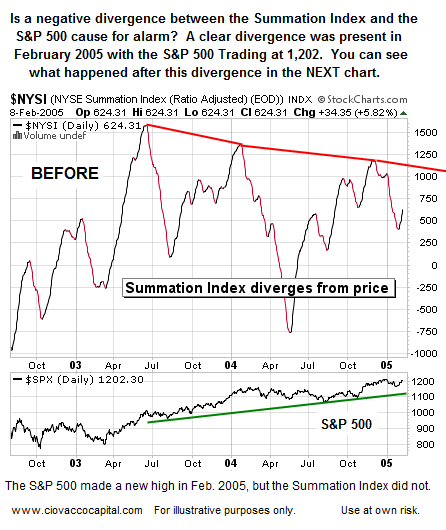
Moving back to the Summation Index and “steep decline” question, the chart below shows the same divergence was present at a very similar point in the last bull market and economic cycle. The Summation Index, a measure of market breadth, was diverging from the S&P 500 on February 8, 2005. February 2005 was roughly two years into a new bull market, just as we sit today roughly two years into the current bull market. We could have presented the chart below in February 2005 as a warning of an impending “steep decline”.
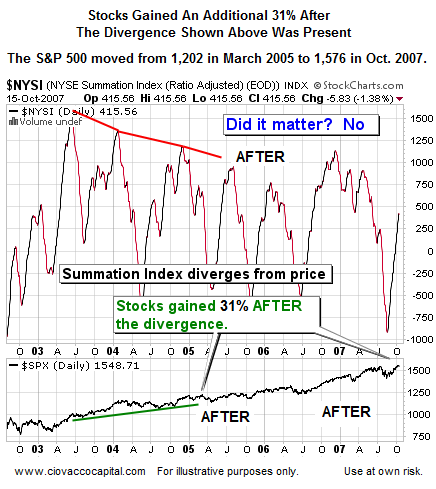
Would the warning and analysis above have helped investors in March of 2005? Not really, since the S&P 500 gained 31% after the divergence shown above was in place. Stocks can advance, even significantly in the face of divergences with the Summation Index.
We are concerned about sentiment, especially when it nears extremes. To demonstrate the difficulty of making buy and sell calls based on sentiment, compare and contrast the risk-reward profile of stocks when the Bull/Bear Sentiment Ratio is at 2.77 (not bad) to a level of 3.00 (not good). The current ratio stands at 2.40, which is not overly concerning. Sentiment still needs to be monitored closely.
As for the markets being extremely overbought, we noted on February 3 that stocks can still advance from what many refer to as an overbought condition. There are no easy answers for when a correction may begin. One thing we all know, and most likely can agree on, is that a correction is coming – when it is due to begin is another matter.
Back on January 19, 2011, we made some projections regarding the market’s extended technical state and the possible onset of a correction; from that post:
The extended technical state of the markets will need to be cleared at some point over the coming weeks. Our market models, along with historical market data, enable us to make some guesstimates regarding when a pullback may begin. Recently, we used the CCM Bull Market Sustainability Index (BMSI) and some back-of-the envelope calculations to project future BMSI levels, based on current BMSI levels and recent trends in numerous technical indicators. This type of projection is not used to make decisions today, but it does help us better prepare for possible chess moves over the next few weeks. This is a planning exercise, not an execution exercise.
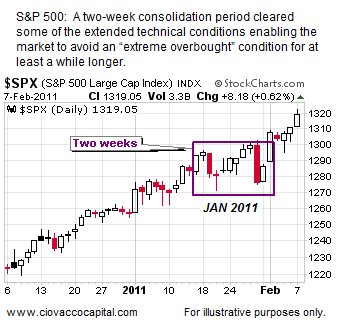
The market did get a pullback, or more aptly referred to as a period of consolidation in mid-to-late January, which reset the correction clock. We did some very limited buying as conditions improved again.
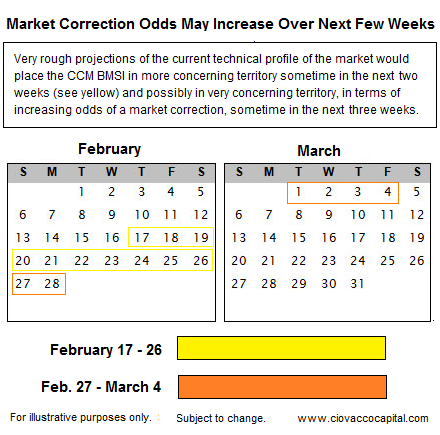
On Monday night, we updated the correction watch calendar using the BMSI and recent trends.
The yellow portion of the calendar above could come into effect in as little as eight trading sessions. The bulls remain in control, but this market could give back some gains in a rather rapid fashion sometime in the coming weeks or months. We do not plan to make any trading decisions using the calendar above, nor should you, but we will monitor our models closely as we approach technical and sentiment extremes.
In terms of strategy, we are happy to hold our current long positions for now. We may be willing to invest relatively small amounts of cash should a decent entry point present itself. Any new investments made with cash need to be very flexible and easily converted back to cash. Some strength in materials (IYM) would have us considering adding a small amount to our existing long positions. We did add a small amount to our existing positions in gold mining stocks yesterday (GDX). The rationale behind the move was two-fold:
- According to Reuters, Dennis Lockhart, president of the Federal Reserve Bank of Atlanta, said U.S. inflation is still below the central bank’s comfort levels and rises in individual prices does not signal broader price pressures are around the corner, and
- Some short-term technicals (not all) improved on the charts of GDX.
Lockhart’s comments are inflationary in nature in that it signals to the markets that the second Quantitative Easing program (QE2) is alive and well in his mind. With the Fed’s eighteen primary dealers still getting cash injections via the second QE2 (see Who Gets The Fed’s Printed Money?), gold stocks, and the market in general (VTI), may hold up longer than we expect. We have to pay attention with an open mind about both bullish and bearish outcomes.
