


How many times has the Greek tragedy been solved over the last two years? How many times have the markets rallied on news of another failed European fix? Time and time again we have seen too little thrown at too large a debt problem and while stocks rally based on this or that news announcement, the credit markets have responded with the same unfliching message to monetary and government authorities, “WE AIN’T BUYING IT!”
No Improvement in Credit Markets = Equity Rallies Suspect
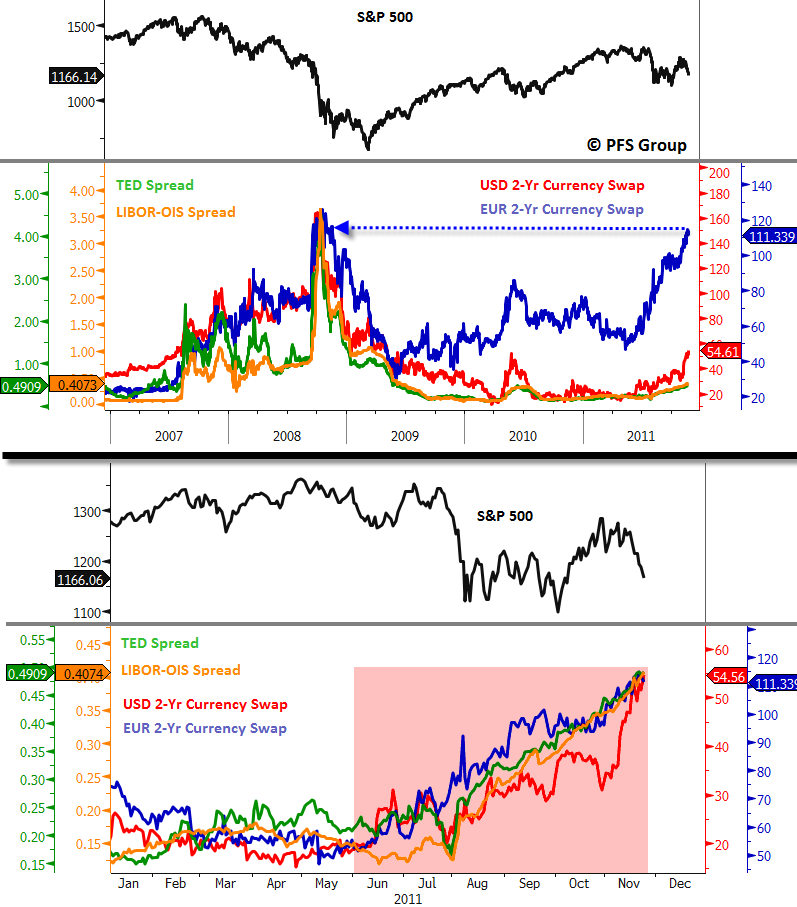
Despite all the so-called solutions to the European debt crisis, the credit markets remain unconvinced and continue to worsen. For example, some key credit spreads like the Ted spread, LIBOR-OIS spread, and USD and EUR currency swap spreads have risen consistently since June despite all of the solutions supposedly announced from Europe over the last few months. While the equity markets (using the S&P 500 as an equity proxy) consolidated between August and September, the four credit spreads that were just mentioned continued to rise and hinted the consolidation in the equity markets was on loose footing (see image below). Even during the sharp October to November rally all four credit spreads continued to worsen with Euro 2-Yr currency swaps nearly reaching their peaks last seen in the 2008 credit crisis.
Source: Bloomberg
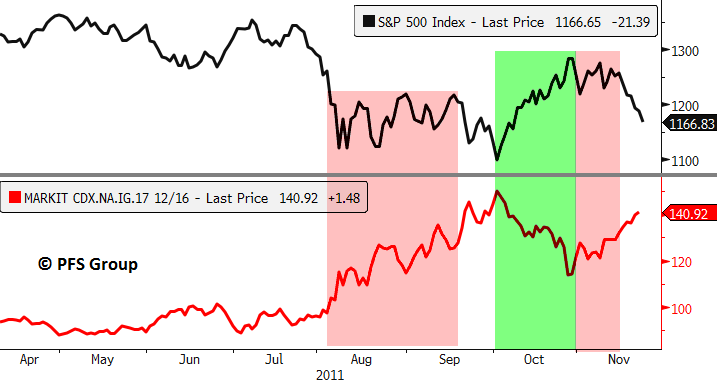
Zeroing in on just the US market, the Markit credit default swap index for North American Investment Grade Corporates (NA IG) has also provided key tells for the S&P 500 based on negative divergences. For example, like the four spreads above, the Markit NA IG CDS index continued to rise during the markets' August to September consolidation (see left red shaded box in image below). It was only when the Markit Index peaked that we saw a decent recovery. As in the last August-September consolidation, while the S&P 500 traded sideways during the first half of November, the Markit Index resumed its march higher and signaled the triangle pennant many technicians cited as a bullish consolidation. Eventually this was proven incorrect and instead reversed to the downside (see right red shaded box below).
Source: Bloomberg
It appears the credit markets will not loosen their pull on the equity markets until a definitive resolution (inflationary or deflationary) to the European credit crisis emerges and, to be honest, right now the credit markets continue to spiral out of control.
Credit default swaps on various European banks continue rising to levels that reflect outright bankruptcy.

Source: Bloomberg
European bank equity stocks plunge below 2011 lows, next stop 2009 lows?

Source: Bloomberg
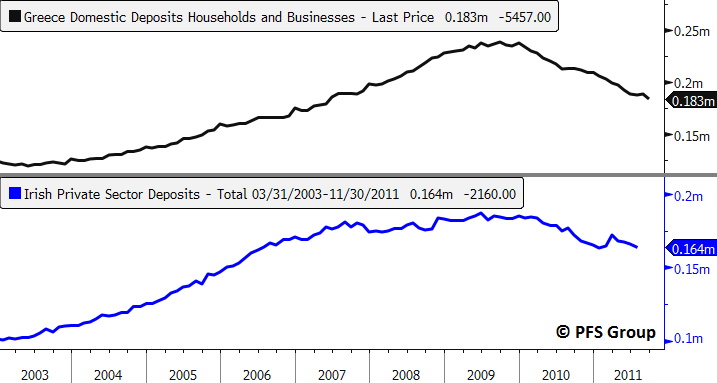
Bank runs across Europe continue to occur as Greek and Irish bank deposits reveal a steady decline. A Wall Street Journal article highlighted this issue, with an excerpt provided below:
EU Banks Struggle to Lure Deposits
An intensifying battle for deposits among European banks is putting pressure on the Continent's banking system, threatening to deprive lenders of a key source of funding as the cost of attracting customers rises.
Individuals and businesses have pulled billions of euros of deposits out of banks in financially shaky countries such as Spain and Italy in recent months, according to bank disclosures and analyst research.
Several large Italian and Spanish banks recently reported double-digit percentage declines in deposits from corporate and other institutional clients, although their overall deposit levels fell more modestly, as lenders hold a greater share of retail ...
Source: Bloomberg
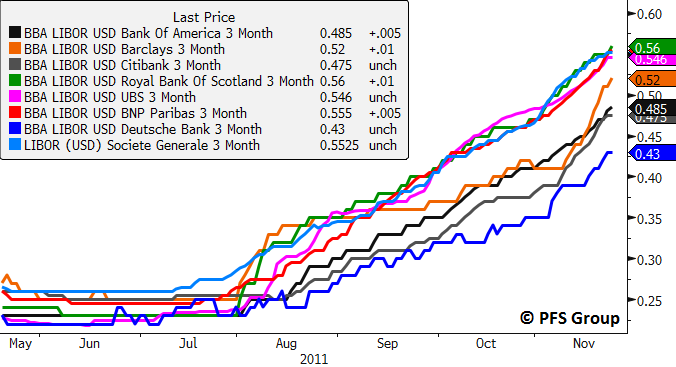
With pressure on the banking industry and deposits shrinking, overnight lending rates among banks continue to rise as banks become more reluctant to lend to each other.
Source: Bloomberg
Fingerprints of 2008?
While no two crises are ever identical, the similarity in terms of the equity markets and credit markets currently to the 2008 crisis are unsettling. The similarity to the path that the S&P 500 underwent in 2008 with that of this year is more than noticeable as shown below. In both cases, after the S&P 500 broke below its 50 day moving average (50d MA) it continued to slide and then staged a bounce to briefly exceed it before plunging into the October low in the present case or the January 2008 low in the last crisis. After the 2008 low, the market consolidated before putting in a marginal new low in March 2008 and then a strong intermediate rally ensued. Similarly, the S&P 500 consolidated for two months after the early August 2011 low before putting in a marginal new low in October which setup a strong intermediate rally. Both the spring 2008 rally and the October 2011 rally failed at the 200d MA and once the 50d MA was broken again on the downside (see red boxes below) another strong leg down in the markets ensued.
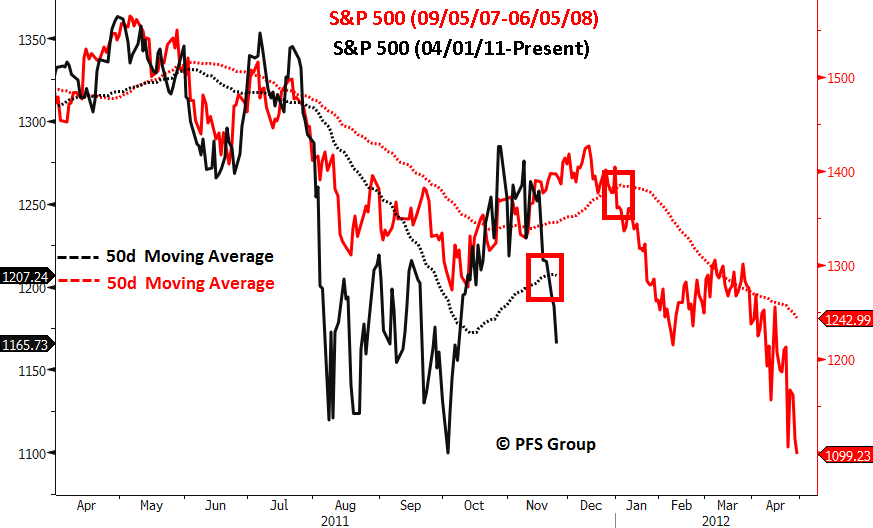
Source: Bloomberg
With the equity markets being swayed this way and that on news headlines, investors should perhaps pay more attention to the credit markets as they have been far less “whippy” and more consistentent with the overall macro trends. While the US took the center stage during the 2008 credit crisis, the current credit crisis belongs to Europe. It was only after a huge plunge in economic activity and financial markets coupled with massive money printing by the US Fed before things finally settled. European markets have met one of those two conditions, their financial markets have imploded and what is needed now is for the ECB to finally blink and prime the printing presses. Until they do the deflationary train will continue to fly off the tracks in Europe and create collateral damage globally. For that reason, our trend model for the S&P 500 shows all five indicators flashing sell signals (0% on buy signals) just as it did throughout 2008.


