


As highlighted in a previous article (click for link), while the economy is on solid footing with little chance of a recession on the near horizon, there are some warning signs that we could be due for a soft patch in Q2. Two leading indicators cited in a prior article were the relative performance of early to late-stage cyclicals and the leading tendency of oil prices relative to stock market gains and economic surprises. With weakening breadth and internals for the market, it appears we may receive our first intermediate correction for the year.
S&P 500 Trend Strength
* Note: Numbers reflect the percentage of members with rising moving averages, 200d MA is used for long term outlook, 50d MA is used for intermediate outlook, and 20d MA is used for short term outlook.
S&P 500 Member Trend Strength
Breaking out the 500 stocks within the S&P 500 into their respective sectors and viewing their long (200d SMA) and intermediate trends (50d SMA) shows the defensive sectors are surfacing as short-term leaders as they possess the strongest short-term breadth (% of members above their 20 day moving average). The most important section of the table below is the 200d SMA column which sheds light on the market’s long-term health. As seen in the far right columns, you have 87% of the S&P 500 members with rising 200d SMAs and 81.8% of its members above their 200d SMA with all ten sectors in bullish territory and with more than 60% of their members having rising 200d SMAs. While defensive sectors, like the utility and telecommunications sectors, have the strongest short-term breadth (% members > 20d SMA), the cyclical sectors, like financials and industrials, are still showing the strongest long-term breadth with 98% and 93% of their members possessing rising 200d SMA respectively. Clearly the weakest links for the market currently are commodity and export-sensitive sectors highlighted below.

Source: Bloomberg
Market Momentum
The Moving Average Convergence/Divergence (MACD) technical indicator is used to gauge the S&P 500’s momentum, on a daily, weekly, and monthly basis for short, intermediate, and long term momentum evaluation. The daily momentum for the market continues to deteriorate as the percent of stocks within the S&P 500 with daily MACD BUY signals rests at 29% currently.
The intermediate momentum of the market has also weakened as 60% of the S&P 500 members have weekly MACD buy signals, down considerably from a peak north of 80% in February.
The weakening short and intermediate momentum has finally dented the market’s long-term momentum as the percent of S&P 500 members with monthly MACD BUY signals declined to 77% from last week’s 85% reading.
As seen in the lower table, the S&P 500 itself is currently on a Daily MACD SELL signal while its weekly and monthly signals remain in BUY positions.

52-Week Highs and Lows Data
Over the last 5 trading days we’ve seen nearly a fourth of the S&P 500 members hit 52-week highs, which is a solid reading. However, three of the top four sectors leading the 52-week ranks are defensive sectors which isn’t surprising given the loss in daily momentum by the cyclicals with fewer daily MACD BUY signals as highlighted above. The fact that the defensive sectors are leading the charge higher puts the market’s advance to new highs on shaky ground.

Source: Bloomberg
Multi-Indicator Summary
As seen in the multi-indicator chart below, we see negative divergences in the percent of members above the 20 day (red line) and 50 day (blue line) moving averages in the second panel and a negative divergence in the percent of members with an RSI reading greater than 70 (third panel) and the percent of members with MACD lines above zero (fifth panel). This negative divergence setup is what we saw prior to the September-November correction in 2012. Typically, intermediate sell signals are identified when less than 70% of the S&P 500 members have MACD lines above zero after being greater than 70%. This can be seen in the last panel below with a breach of the 70% threshold circled with two such signals given in 2012 and we are on the verge of the first sell signal in 2013.
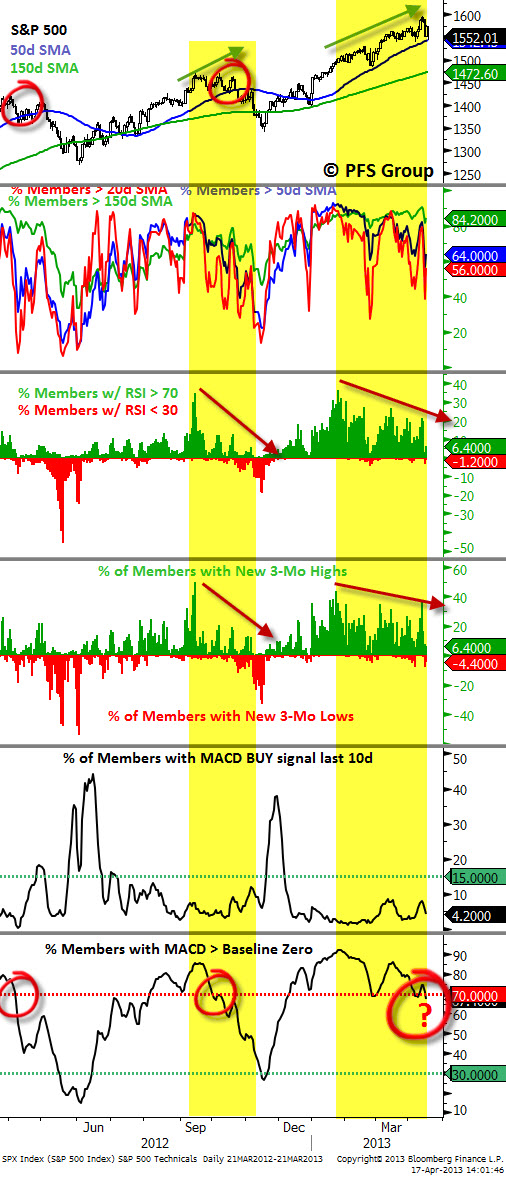
Source: Bloomberg
Summary
The market has rallied over the last month being carried mostly by the defensive sectors while momentum and breadth in the cyclical sectors has continued to weaken. Given more than half of the S&P 500 is made up of cyclical sectors, it is difficult for the defensive sectors to carry the market entirely on their shoulders and it appears the defensives have finally buckled under the weight as the market appears to have started its first correction of the year. The S&P 500 has still failed to break its 50 day moving average and sentiment is becoming overly bearish, setting up the possibility for a brief oversold bounce. If any near-term bounce is weak and fizzles, we may be treated to an eventual break through the 50d MA by the S&P 500.


