


The S&P 500 rallied just over 20% from the August lows to the highs reached earlier this week, and has rallied more than 6% since the late November lows, but a pullback or consolidation is likely in the cards. Given the strong and persistent move in equities since late summer bullish enthusiasm is running strong which often serves as headway for further market gains. We are beginning to see some signs of an impending intermediate market peak as we have some thinning of the ranks in terms of rally participation. New money may be best served waiting on the sidelines until a correction occurs or bullish enthusiasm is reigned in.
Everyone is Bullish
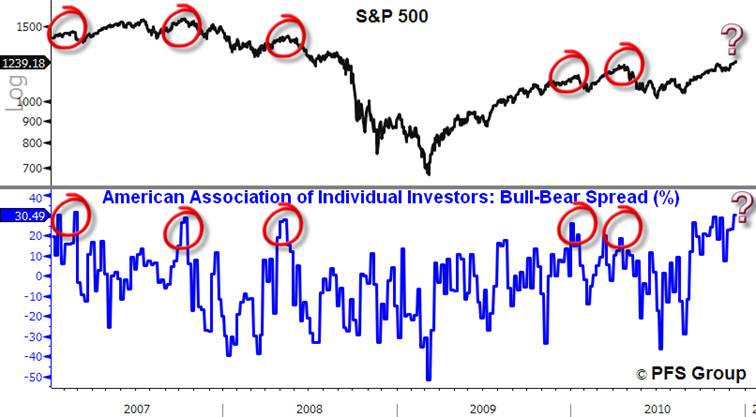
Some of the best buying opportunities occur when everyone is bearish while the bulls are hard to find. Conversely, some of the best selling opportunities to take some profits off the table occur when everyone is bullish. Below is the American Association of Individual Investors (AAII) retail investor sentiment data in which the spread between the bulls and the bears is graphed below the S&P 500. Currently we are at one of the highest spreads seen over the last three years and as seen below, typically intermediate corrections ensue to bring down over zealous investors. While sentiment has remained elevated for weeks now without a correction, investors should remain alert for a potential selloff.
Source: Bloomberg
Another measure of sentiment is options and the ratio of put (bearish bets) to call (bullish bets) buyers. One of the things that many savvy market technicians commented upon for becoming more defensive back in April of this year was the very low put/call reading, which hit the lowest levels in six years. We are not that far from the extreme seen in April and with such strong bullish sentiment it will be hard to see further gains ahead as everyone who is bullish is already likely fully invested and the pool of new buyers is likely to dry up, leading to the next market correction.

Source: StockCharts.com
Market Breadth Wanes, Signaling Likely Correction on the Horizon
Market peaks are often characterized by fewer and fewer stocks rallying higher and when the bulk of stocks begin to fall the overall stock market indexes are weighed down and correct. We can view this type of deterioration in breadth by viewing the percentage of stocks above their 200 day moving averages (200d MA). Below we see the NYSE on the top panel and below it the percentage of NYSE issues above their 200D MA. At prior market peaks over the last six years the percentage above their 200d MA fails to confirm the price high in the index and this deterioration precedes a market pullback. We are seeing the same signs again as the percentage of stocks above their 200d MA is failing to confirm the recent high made this week. Moreover, the percentage of stocks hitting above their 200d MA is even below the levels seen in April which indicates the current market rally is weaker than the one seen earlier in the year. That said there are plenty of fixed income securities that trade on the NYSE so a good deal of the recent weakness in breadth may be reflecting lower fixed income securities rather than a deterioration in stock breadth on the NYSE.

Source: StockCharts.com
Echoing the same message as the percentage of stocks trading above their 200d MAs on the NYSE, the percentage of stock issues trading at 52-week highs is beginning to diverge with price and at the same time the percentage of issues hitting 52-week lows is beginning to spike (see lower panel below), which is characteristic of short-term tops.

Source: Bloomberg
While not showing the same degree of deterioration, the percentage of issues on the NASDAQ that are trading at 52-week highs is weakening.

Source: Bloomberg
All of the above suggests that much of the fuel coming off the August lows may have been spent and the market may have to digest recent gains and work off extreme bullish sentiment readings. While a correction or consolidation is likely in the cards there is no mistaking that the trend remains bullish as evidenced by higher highs and higher lows in the major averages. Until the trend shifts any pullback is best seen as a buying opportunity rather than a major market peak.


