


The markets continue to display impressive strength though we did see a slight deterioration over last week with the market’s short-term outlook. Most of the deterioration in breadth has occurred in cyclical sectors which is likely due to some profit taking in that area. This could be just evidence of a consolidation in the market or a prelude to a short-term top. Regardless of how the market works off its overbought condition, given the strength in both long- and intermediate-term outlooks, any pullback in the markets will likely prove short-lived.
S&P 500 Trend Strength
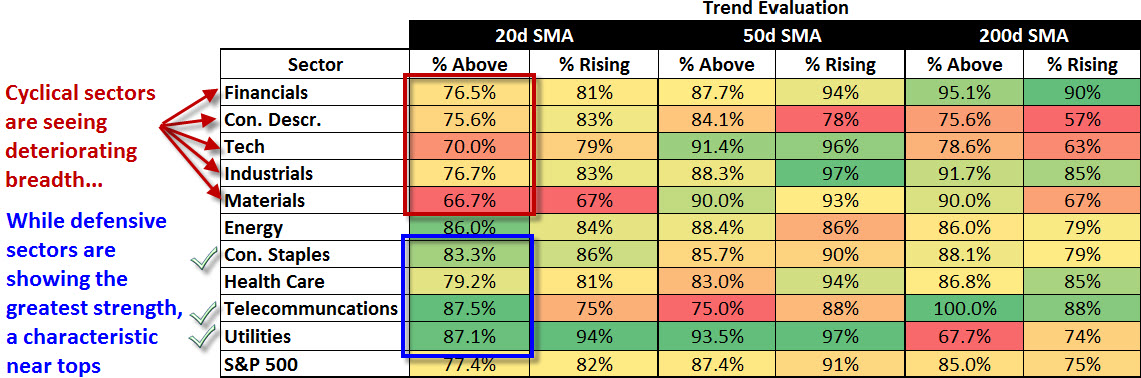
* Note: Numbers reflect the percentage of members with rising moving averages, 200d MA is used for long term outlook, 50d MA is used for intermediate outlook, and 20d MA is used for short term outlook.
S&P 500 Member Trend Strength
Breaking out the 500 stocks within the S&P 500 into their respective sectors and viewing their long (200d SMA) and intermediate (50d SMA) trends shows the defensive sectors surfacing as short-term leaders as they possess the strongest short-term breadth (% of members above their 20 day moving average).
Source: Bloomberg
Looking at the short term picture (% above 20d SMA) shows a bit of a “risk off” trade occurring which may indicate a short-term top is forming. For example, Looking at the difference between today and last week’s numbers for the percent of members in each sector above their short-term moving average (20d SMA) shows deterioration in cyclicals most tied to the global economy and strength in the defensive telecommunication sector.

Source: Bloomberg
Market Momentum
The Moving Average Convergence/Divergence (MACD) technical indicator is used to gauge the S&P 500’s momentum, on a daily, weekly, and monthly basis for short, intermediate, and long term momentum evaluation. Compared to last week, the percent of stocks within the S&P 500 with daily MACD BUY signals worsened from 62% to 48%. This decline in the market’s short-term momentum coupled with the message from the short-term trend deterioration in cyclicals and strength in defensives highlighted above does suggests we may get a short-term dip in the markets. That said, the market's intermediate and long-term momentum improved which suggests the market could head higher after any short-term pullback.
The intermediate momentum of the market remained steady at a strong 84% this week. Further evidence that there hasn't been a dent in the market's longer-term outlook is the slight improvement with the percent of S&P 500 members with monthly MACD BUY signals increasing from 69% to 70%.
With that said, the S&P 500 Index itself is on a daily (short-term) sell signal, the first sell signal since the end of December.

52-Week Highs and Lows Data
We have a well-represented market rally as more than one third of the entire S&P 500 hit a 1-year high in the last five days. As seen below, we have a very robust market rally on our hands and there is very little red below. That said, we are seeing a shift in the sectors that are hitting new highs. The utility sector had been absent in hitting new 52-week highs but has increased from last week’s levels where only 19.36% of its members hit a 52-week high over the prior trading week to 32.26% today. Health care, industrials, and financials continue to be well represented but we have seen a drop off in the materials and consumer discretionary sectors, both considered cyclicals.

Source: Bloomberg
Not only do we have a broad-based market rally when viewing all ten sectors, but we have broad-based participation based on market cap as seen below.

Source: Bloomberg
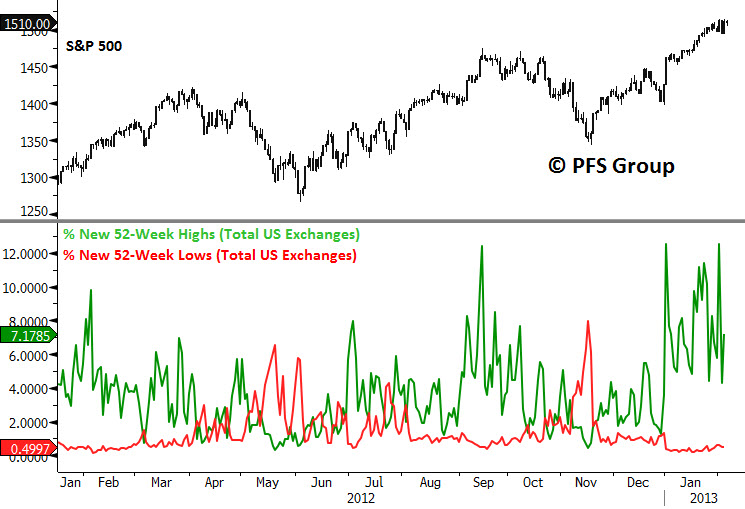
Taking a historical look at 52-week highs and lows we see that 52-week lows remain absent while 52-week highs continue to remain strong. While we are becoming overbought and due for a pullback, I would expect any pullback to be mild in nature and unlike the two corrections in 2012 as we are not seeing the same degree of negative divergences in new 52-week highs now as we did leading into those two tops.
Source: Bloomberg
Summary
The market continues to march higher in 2013 as the short-term to long-term trends and momentum for the S&P 500 remain bullish. The slight deterioration in the daily readings for MACD BUY signals as well deterioration in short-term trend strength in cyclicals suggests the market may cool off a bit ahead to help alleviate the market’s overbought condition. After a period of cooling off the market is likely to hit new highs as the intermediate and long term outlook for the markets continue to strengthen.


