A key concept for investors to grasp is that money, once created, will always find a home and the two primary places are the economy and monetary assets. While the economy is moving along at a decent clip it certainly is not matching the roaring growth rate of the Fed’s balance sheet, indicating that much of the Fed’s largesse is finding a home somewhere else. In my opinion, that other monetary depositing hole is the US stock market. When short-term interest rates remain at severely depressed levels, when rising longer-term interest rates are causing rising losses for fixed income investors, and with foreign equity markets showing weakness recently, then the only game in town is the US stock market.
Money Makes the World Go Round
It is no widespread secret that the Fed is directly tracking the stock market as even Fed Chairman Ben Bernanke commented on the stock market as “proof” that his quantitative easing (QE) programs are working as outlined in the article below (emphasis added).
Bernanke Lays Out Evidence QE2 Is Working
Interestingly, these developments are also remarkably similar to those that occurred during the earlier episode of policy easing, notably in the months following our March 2009 announcement of a significant expansion in securities purchases. The fact that financial markets responded in very similar ways to each of these policy actions lends credence to the view that these actions had the expected effects on markets and are thereby providing significant support to job creation and the economy.
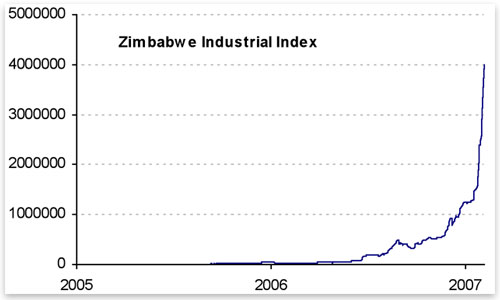
If I was a reporter at this press conference I would have asked him how he would have gauged the success of the Zimbabwe central bank whose run-away printing presses caused their stock market to go through the roof, not to mention their cost of living. The Zimbabwe Industrial Index was up 595% in the first four months of 2007, and up more than 12,000% from April 2006 to April 2007.

Source: https://mises.org/daily/2532
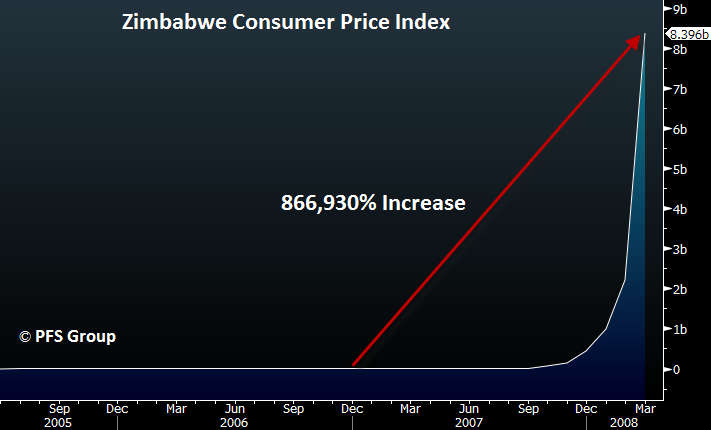
However, what went up even further was the inflation level in the country, with citizens of Zimbabwe pouring their money in the stock market to try to keep up with inflation. From January 2007 to March 2008 the Zimbabwe Consumer Price Index rose 866,930% as the country underwent hyperinflation.
While our Fed’s balance sheet is not expanding to the same degree as the Zimbabwe central bank’s in 2007-2008, the point is (as investors) we need to be aware of what central banks are doing as their actions directly affect the stock market. If the central bank has the pedal to the metal, then we should remain invested or see our purchasing power dwindle by remaining in cash.
The image below should help make this point clear as there is a direct relationship between the monetary base level and the S&P 500. When the Fed began to expand the monetary base (green line below) in March 2009, lo and behold we had an end to the last bear market as the S&P 500 (black line below) finally bottomed. Track with me the progression of both series over the last two years and you will notice that short term peaks in the monetary base often lead short term peaks in the S&P 500, and troughs in the monetary base often lead troughs in the S&P 500. The January to February 2010 sell-off in the market was preceded by a pullback in the monetary base and the decline stopped weeks after the monetary base began to expand again. Remember the sharp summer correction last year that began in April? Note the peak in the monetary base in the prior month that also preceded the correction in the markets. Fast forward to today and not only do we not see a peak in the monetary base but a sharp and pronounced expansion with Bernanke’s QE2. Is it any wonder then with a Fed bent on inflating financial assets that money is moving out of the bond market and money markets and trying to preserve its purchasing power by moving into the stock market and gold?
It’s Not Just the Fed
While the US Fed may be expanding its balance sheet at a strong clip, it isn’t alone. Central banks the world over are printing money well above their economic growth rates, pushing up the prices of real assets from real estate to commodities. Double-digit money supply growth rates are all too common across the globe as seen below, with plenty of high single digit rates as well.
Is it any wonder that gold is rising against all world currencies as it is being seen as the only sound currency left? I’ve created equally-weighted currency composites to track the movements in various currencies. My G10 Index is an equally-weighted currency index using the G10 currencies and I’ve also created an equally-weighted Emerging Market Currency Index and an Asian Currency Index, with each based relative to the USD. As seen below, when gold is priced in US dollars (top panel), emerging market currencies, the developed currencies of the world (G10, blue line below), or in Asian currencies, gold is advancing uniformly as currency debasement is a global phenomenon.
Maintaining Purchasing Power but Watching For Tipping Points
If the US Fed is intent on significantly inflating financial assets in the hope of restarting the credit cycle and preventing another recession, then we as investors should have purchasing power protection as a key tenant to our investment philosophy. Maintaining a significant commodity exposure in general, and gold in particular, is a key way for investors to maintain purchasing power as it has been far too costly to hold cash in the face of continued devaluations. There will come a point where rising inflation and commodity prices will choke the economy and stock market just as was the case in 2007, but prematurely moving to the life rafts may cause investors' purchasing power to unnecessarily suffer as the Fed-induced inflationary train takes off. Overall, it will be extremely important from here on out to monitor the inflationary drag of higher commodity prices on both the economy and the stock market in order to prepare for when a tipping point similar to 2007 may occur. One such signal for a potential tipping point is, as you probably know, oil prices.
The cost of oil pervades the economy as petroleum is used in a surprising number of products (click here for a link to a partial list) and so rising oil prices directly raise the input prices for hundreds and even thousands of products. They can rise to such an extent to choke demand and reduce discretionary spending and even lead to recessions. The significant spike of oil prices from a low of .30 a barrel in January 2007 to nearly doubling by reaching .28 a barrel in November 2007 took a major toll on the economy. For a while in 2007 both the S&P 500 and oil prices advanced simultaneous but in the second half the stock market peaked while oil continued to head higher. Looking at a scatter plot of oil prices and the S&P 500 during 2007 suggests the tipping point was roughly between - a barrel.
While - oil make have crippled the last recovery, the same price level may not be the choking point in this present expansion. Matt Millar wrote an excellent article recently on oil shocks and the economy and I’d recommend readers to review it (GDP & Oil Prices). Matt argues that oil shocks typically require higher prices above prior recent spikes, with recent being defined as three years, to have a resulting shock on the economy. Much of this is because, in time, we learn as a society to cope with and adapt to the new price level by making incremental changes. Thus, while - oil may have been a shock in 2007, many US citizens had already learned to psychologically or physically adapt to the same price the second time around.
A look at the recent correlation between oil prices and the S&P 500 does tend to support this notion as the stock market headed higher even with oil in the - region. However, while it does not appear that - oil is having the same economic crippling affect as it did in 2007, we do appear to be getting closer to a potential tipping point. This is seen in the scatter plot below that shows, as oil has headed higher from to 0 a barrel, the rate of accent in the S&P 500 has begun to slow.
While oil prices may be finally reaching a point to choke economic activity, the market may continue to advance but at a much slower pace. We should also take into consideration that Bernanke wasn’t printing hundreds of billions of dollars back in 2007 as he is presently. To determine when the money printing efforts by the Fed may lose steam, we can use leading economic indicators to help us determine the proper time to exit the markets, which also provides an objective indicator that has emotions fully stripped out of the equation.
One such tool that I often highlight is the Economic Cycle Research Institute’s (ECRI) Weekly Leading Index (WLI), which is shown below in red versus the S&P 500 in black. Please note that the WLI turned negative in late 2007 just as the S&P 500 was topping (first dashed vertical red line) but remained positive throughout 2004-2007 so that investors tracking it stayed invested until the bear market began. However, the index turned positive in mid 2009 and was telegraphing investment managers to also turn positive. In 2010 the WLI declined sharply and moved into negative territory soon after the markets peaked in 2010. It was this sharp decline in early 2010 that led me to become cautious and recommend defensive sectors over cyclical sectors (Contrary Investing) while the markets were moving higher. However, when Bernanke began leaking his intentions for another round of QE in August 2010 I reversed my bearish stance and turned bullish (Investment Implications of a Bottom in Leading Economic Indicators).
In short, it’s important not to remain ultra bearish when global central banks are committed to reflating their respective economies. Zimbabwe's stock market serves as a good example. In times such as this, maintaining purchasing power is of utmost importance, which can be achieved through allocating one’s assets towards commodities in general and gold in particular. While central banks are able to inflate assets with printed money, there are choking points when high inflation levels stifle economic activity and can lead to recessions. For this reason, keeping an eye out for the tipping point where commodity prices rise too far, too fast, is key. However, rather than trying to call a top in the markets at their current levels we maintain our focus on leading economic indicators in determining when high commodity prices lead to a tipping point. Right now leading indicators continue to improve and suggest the time to be bearish is not upon us. Until they become bearish, maintaining purchasing power should be investors' number one priority.


