


The news this week has been dominated by the Fed’s historic press conference and the subsequent moves in metals and the dollar. Fed Chairman Bernanke pretty much gave a green light to USD bears and precious metal bulls in once again advancing the illusion that rising commodity prices are in no way related to our weakening currency but purely a byproduct of a strong global economy. When the world’s most powerful monetary authority shows such little regard for dealing truthfully with current realities on the ground, is it any wonder the USD continues to plummet as gold and silver climb even higher?

Source: Bloomberg
“Those who fail to learn the lessons of history are doomed to repeat them” – George Santayana
The above famous quote goes hand in hand with another one from Mark Twain, “History doesn’t repeat itself, but it does rhyme.” Many lessons can be gleaned from history and, while no two periods are identically alike, there are often many similarities to learn from. The current period, for example, is often compared to the Great Depression in regards to unprecedented government action as well as with the 1970s in regards to trends in commodities and inflation. Over the years I have often drawn parallels to the 1970s given a similar pattern seen in the stock market and the S&P 500. In September of 2008 I penned a piece entitled, “Déjà vu? LET'S HOPE NOT!”, where I presented the following charts that give you an idea how exceptionally similar the patterns are between then and now:

Given the unique nature of how the markets and the dollar played out in the 1970s, I thought it would be useful to see how the rest of the decade similarly performed. When looking at gold and the USD, it does appear we are following the 1970s script, but on a more accelerated pace. Most of this is well owed to the double rounds of money printing or QE a-la Helicopter Ben to save the economy, a program that didn't exist back then.
Shown below is the USD Index for the current period on the top panel and then the USD Index, gold, and the S&P 500 from 1972-1980. As you can see in the first two panels, the USD Index in the present time is tracing out a similar pattern to the later 1970s. In the 1970s the USD bottomed in 1973 and then again two years later in 1975. After the 1975 bounce the USD Index held up relatively well until it peaked in 1976 and began to slide. It had a brief bounce in 1977 before it began a waterfall decline in which it fell nearly 24% into the 1978 low.
Once the support line for the USD Index connecting points A-B-C was broken in early 1978, gold went on to rally more than 300% into the 1980's peak and the S&P 500 rallied nearly 37% into early 1980 and over 60% by late 1980. While the S&P 500 staged an impressive rally in nominal terms, in real terms (inflation-adjusted by the CPI Index) the S&P 500 fell more than 10% heading into 1980 and it gave a false sense of rising wealth creation and prosperity.

Source: Bloomberg
Looking at the figure above, it does appear that the pattern seen in the dollar is repeating the 1970s path and we may be entering the waterfall decline in the greenback that was seen in 1978. If that is the case, then cash is indeed trash and don’t be surprised to see the stock market rally in nominal terms and gold and commodities to jump significantly.
What is also interesting to note from that time is that the USD Index’s sharp sell off ended in 1978 and gold had a mild pullback before vaulting much higher. After the USD’s initial sharp bounce it essentially traded sideways and gold continued higher unabated.
While it may seem counterintuitive for gold to rally along with the dollar, there were other factors at work. Given the slide in the USD in 1978 import inflation was building and by the time the USD Index bottomed inflation accelerated and real interest rates turned negative. Some of the strongest returns in gold in the 1970s came when real interest rates were negative as monetary policy (interest rates) fell behind inflationary trends. This is seen in the figure below which shows in the shaded red period that, while the USD was firming, real interest rates were on a straight path southwards and it wasn’t until BOTH the USD AND real interest rates headed higher together (shaded green region) that gold finally peaked and its secular bull market came to an end.

Source: Bloomberg
Fast forwarding to the present time, at 0.77%, real interest rates (10yr UST yield less CPI YOY % Chg) are heading south and not too far off from going negative. Real rates are likely to plunge through the rest of the year given the slide in the USD.
Back in 2009 I penned a piece in regards to the inflation and deflation arguments (“Another Look at the Inflation/Deflation Debate”). A few investment strategists were making the claim that given the large manufacturing and labor spare capacity (and what they accurately forecasted would be near anemic loan growth given the bursting of the credit bubble), that it would be unlikely to experience strong inflation and that deflationary assets such as bonds would be the smarter investment.
However, given our transition from a manufacturing-based economy to a service-economy I showed that trends in the USD and import prices showed a stronger correlation to inflation rates than did labor costs which they argued were the main factor in the spiraling inflation of the 1970s.
A weak USD makes foreign imports more expensive and the present slide in the USD is going to lead to a spike in import inflation ahead. The year-over-year (YOY) rate of change in the USD Index leads import price inflation by several months and argues for a spike in import inflation north of 4% in the coming months.

Source: Federal Reserve, BLS
One of the main culprits for rising US import prices is China, given our large trade deficit with them. Shown below is the USD and Chinese Renminbi exchange rate where you can see how periods in which the Renminbi strengthens relative to the USD (black line declines) leads to rising import prices from China. Consequently, the appreciation in the Renminbi since mid 2010 has led to a resurgence in US import inflation. It is the below development that should cause US Congress members to be careful what they wish for in terms of China revaluing their currency.
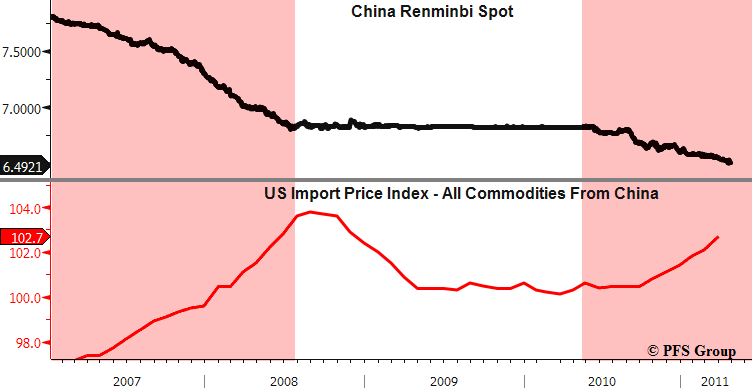
Source: Bloomberg
With the easy monetary policy and complete lack of recognition by Fed Chairman Bernanke in terms of what the USD is doing to commodities and import prices, we are likely to see the dollar continue to weaken ahead which has resulted in the major 3-year trend line support being broken as it was in the 1970s. Back then, once support was broken we witnessed gold rally more than 300% and the S&P 500 rally in nominal terms but decline in real terms. The present slide in the USD will lead to higher inflation and thus lower real interest rates which will only be bullish for gold ahead. So far the Real Broad Trade Weighted USD Index sits at all-time record lows with gold at all-time record highs. Until Ben Bernanke restores the Fed’s credibility in terms of fighting inflation, and until the US Government gets serious about its long-term fiscal position, we are likely to see further records set in the USD and gold, in opposite directions.


