The following is an excerpt from the June 18, 2013 blog for Decision Point subscribers.
Despite investor skittishness as they wait for news out of the Fed tomorrow, the market pushed higher to continue this week's rally.
Stocks: Based upon a 12/10/2012 Thrust/Trend Model buy signal, our current intermediate-term market posture for the S&P 500 is bullish. The LT Trend Model, which informs our long-term outlook, is on a buy signal as of 12/13/2012, so our long-term posture is bullish.
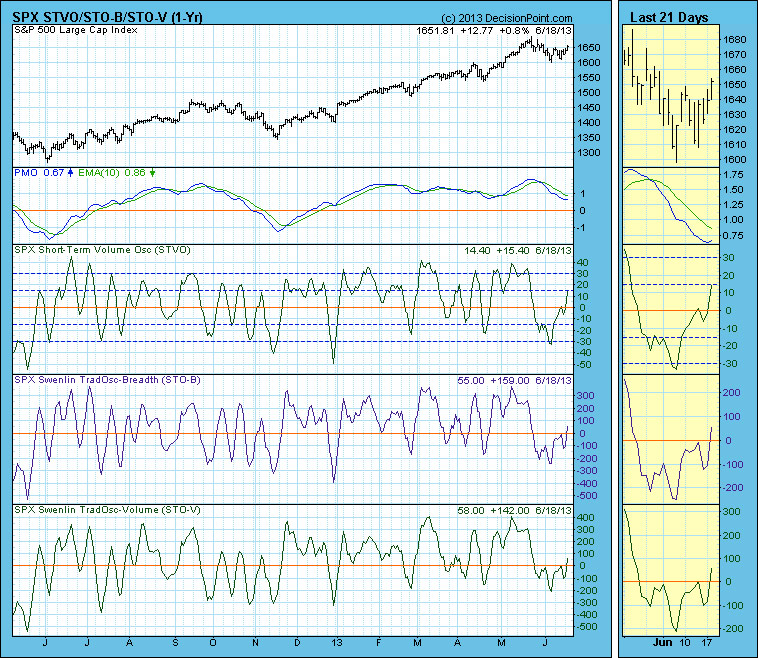
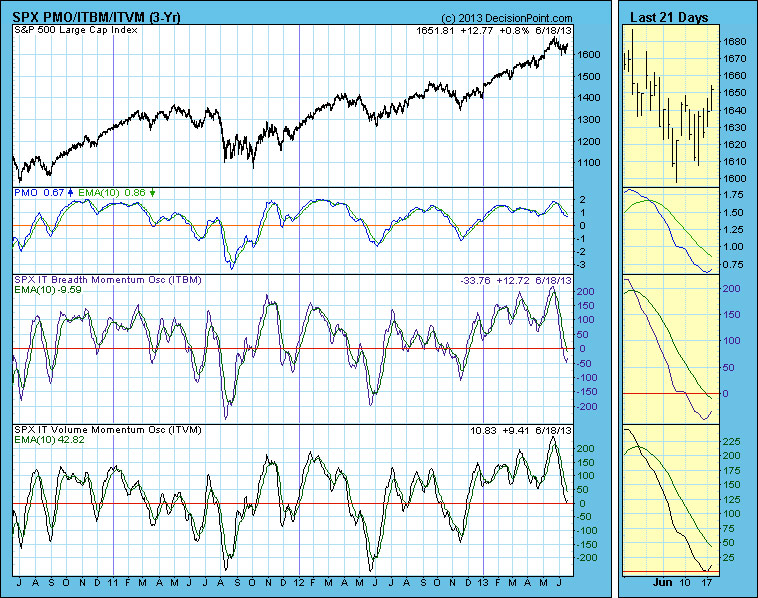
Price continued to rally after breaking out of the triangle pattern. The PMO turned up today on mediocre volume. In the thumbnail, price broke above the neckline of the bullish double-bottom pattern that we have been watching for the last few days. When a double-bottom pattern executes, the minimum upside target is the length of the pattern from bottom to neckline. In this case, that would put price at the top of the rising trend channel or just above it around 1700.
The CVI and Participation Index - UP hit climactic readings today.
Short-term indicators are neutral except for the STVO which just reached somewhat overbought territory.
The ITVM turned up today, joining the ITBM which turned up yesterday.
Conclusion: The market is short-term bullish given that ultra-short-term indicators just hit climactic readings as price is starting to come out of a bottom, and there was the execution of the bullish double-bottom pattern. The apple cart could be upset if the Fed announces tapering or ending its bond buying program tomorrow after its meeting.
Gold: As of 12/6/2012 Gold is on a Trend Model neutral signal. The LT Trend Model, which informs our long-term outlook, is on a sell signal as of 2/15/2013, so our long-term posture is bearish.
Gold suffered today. According to Kitco.com, this was primarily due to sellers not a strong dollar. The dollar was only up .1% today, so that makes perfect sense. The PMO turned down which is also bearish.
Technical analysis is a windsock, not a crystal ball.


