


This morning Lakshman Achuthan, chief operations officer of the Economic Cycle Research Institute, visited with Tom Keene on Bloomberg TV to discuss his ongoing recession call for the U.S. Achuthan has taken much grief for his call about the U.S. recession since last year.
My friend Doug Short, who should be part of your regular reading, follows the ECRI index closely each week with some excellent analysis. His most recent commentary he states: "A cornerstone of his argument is that four key indicators used by the NBER to make official recession calls are, as he put it, 'rolling over.' Here are the four indicators in question. Only one, real retail sales (which is the most volatile of the lot) had been showing intermittent signs contraction but subsequently improved in the July data. There is no question that the recovery from the Great Recession has been frustratingly slow, but the overall trend has been one of improvement. The next of the Big Four, and the first for August data, was the Nonfarm Employment in this morning's employment report.

Here is one of my Big Four charts with ECRI's recession call annotated.
But at this point, economic data have consistently contradicted Achuthan's "rolling over" assertion and claim that we're now in a recession, a position that is rapidly becoming an embarrassment."
Doug's analysis is correct that we are not currently in a recession, which for the ECRI, makes his current commitment to his call a very tough position to be in.
However, we are in very unusual times where Central Planning is artificially influencing traditional economic indicators such as the Leading Economic Indicators. Yield spreads are suppressed by interventions while direct liquidity injections have boosted asset prices lifting the S&P 500. These are two major components of the LEI and have potentially skewed results.
While I am neither defending, or endorsing, the ECRI's call - I do want to make the point that while we may not be in a recession from technical perspective - a look at the number of individuals on unemployment, food stamps, welfare, etc. tells a different story. While pictures of the "bread lines" tell the story of the "Great Depression" - today, those "bread lines" come in the mail.
The National Bureau of Economic Research (NBER) provides the official government dating of recessions. However, this recession dating always occurs after the fact as backward revisions to the economic data is available. For example, in December of 2007 we wrote in our weekly newsletter that: "We are now, or are about to be in, a recession." I took much flak for that call over the next 6 months as the media, analysts and economists pronounced that "it is a golidlocks economy", "a soft landing scenario" and the "subprime was contained." Of course, it was not. However, a full year later, after revisions to the economic data was compiled, the NBER pronounced that the recession started in December of 2007. Of course, by that time, it was far too late to be of any use to investors.
The problem today is trying to predict an event that will have a significant event on investor's assets, the average historical draw down during recessions is more than 30%, when the current data is not completely reliable, there are artifcial inducements via central planning and other natural events that could occur to skew the data. Let me give you an example of what I mean.
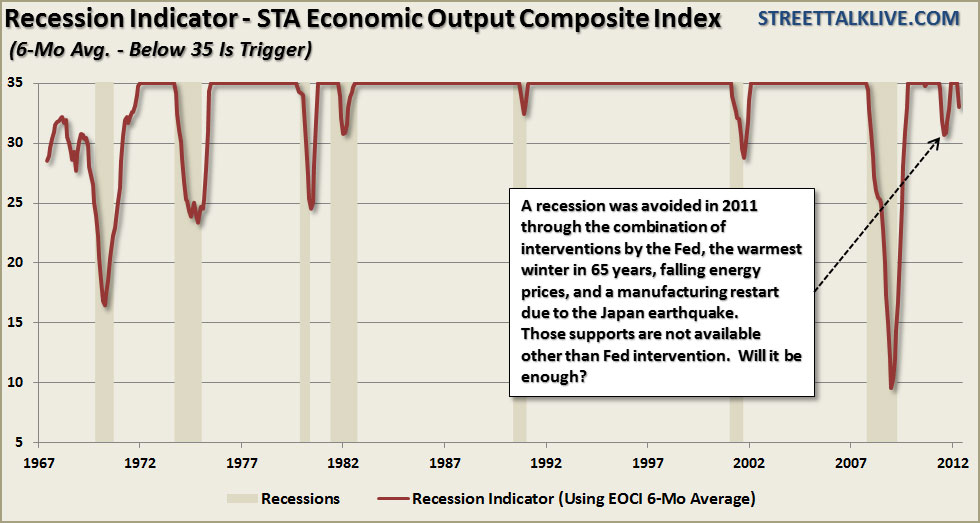
The chart above shows a group of economic indicators from the manufacturing standpoint. The STA Economic Output Composite Index (EOCI) is comprosed of several Federal Reserve Manufacturing regions, the CFNAI (composed of 85 subcomponents), the ISM Composite Index (an average of both ISM Indexes), the Chicago ISM and the NFIB Small Business Survey. This is a very broad look at the economy from some of the major indicators.
Going back to 1967 whenever the 6-month moving average of the EOCI has fallen below 35 the economy was either in, or about to be in, a recession. That is until the summer of 2011. During 2011 there was a culmination of events that prevented the economy from slipping into recession:
- The Japanese earthquake led to a manufacturing shutdown combined with the debt ceiling debate which caused a contraction in consumer spending. This led to pent up demand that was unleashed during the last two quarters of the year.
- Further boosting consumption was a fall in oil prices which gave an effective billion tax credit to consumers.
- The warmest winter in 65 years allowed construction and manufacturing to continue through the winter months which skewed the seasonal adjustments to economic indicators, like employment, to the upside.
- Due to the exceptionally warm winter utility expenses declined sharply giving another ample effective tax credit to consumers.
- The Fed engaged in Operation Twist along with the ECB which launched two rounds of Long Term Refinancing Operations which supported the financial markets and boosted consumer confidence.
Importantly, notice none of these supports for the economy was organic but rather a simultaneous collision of artifcial and one-time events that prevented a recession. The problem today is that outside artificial stimulus - the "mother nature" effect is not currently available as the composite indicator is again signaling a recession through the manufacturing side of the equation.
However, let's get back to Doug's analysis for a moment. Doug uses the 4 most important components of the economy - consumer spending which makes up more than 70% of GDP, industrial production which leads to employment and incomes which drive consumption. The chart below shows a composite index of these four major components analyzed on a quarterly change basis.

There are some very important takeaways from this type of analysis. The first is that historically recessions occur VERY quickly. This is why analysts and economists are generally caught flat footed when they occur. Secondly, the current choppiness of the economic data is very similar to what we saw just prior to the last recession as the credit induced real estate bubble was in tact. What is important to notice is that it is NOT uncommon for the underlying components of incomes, production, employment and consumption to tick up, even sharply, just before a collapse into a recession occurs.

The table shows (click to enlarge) the where the economy stood just one quarter prior to the onset of recession. In every case the economy was "muddling" along until it wasn't. Currently the Composite Economic Indicator as shown above is at .30% with the economy growing at a very weak 1.7% annualized rate as of the second quarter. The composite indicators has fallen 50% from last quarter's reading of .60%. At currently levels neither the index or the quarterly change in the components is signaling an immediate recession. However, with history as a guide, that does not really tell us much of where we will be in the next quarter.
The problem that exists for myself, Doug, the ECRI and any other student of the economy is that we are all working with data on a lagging basis that continues to be revised at much later dates. Therefore, all of the analysis contained in this article will change when the next set of revisions occur.
While the general bias of investors is to remain eternally optimistic hoping that markets will continue to advance skyward, even in the face of declining economics and fundamentals, it is important not to dismiss a contrarian call. The ECRI has stuck its neck out on their recession call which has clearly been early due to the artificial influences on the economy. That does not mean that it should be dismissed out of hand. By the time that economic data is revised, and the NBER is able to make the recessionary call - it will be far too late to be of any use to investors. As we stated above, going back to 1900, the average decline during a recessionary economy has been more than 30%, however, as we saw in 2000 and 2008, it can often be worse.
Source: Street Talk Live


