


"New U.S. single-family home sales surged in September to their highest level in nearly 2-1/2 years, further evidence the housing market recovery is gaining steam. The Commerce Department said on Wednesday sales increased 5.7 percent to a seasonally adjusted 389,000-unit annual rate — the highest level since April 2010, when sales were boosted by a tax credit for first-time homebuyers."
That was the headline paragraph from CNBC following the release of the New Home Sales report from the Commerce Department this morning. As we discussed recently in our post on Housing Starts and Permits the euphoria around the entire real sector is still very premature.
The headline number that is released is a seasonally adjusted and annualized number based on the actual month to month data. The Commerce Department reported that sales of new homes increased 5.7% to 389,000 in September. This increase against August's downwardly revised pace of 368,000-units. However, in reality there were only 31,000 ACTUAL new homes sold across the entire United States in September. This is the same number that was sold in August and down from the 35,000 units sold in May. In other words, the entire 5.7% increase in new home sales in September was strictly seasonal adjustments.
The chart below shows the "housing market recovery" in perspective to historical levels on both a seasonal and non-seasonally adjusted basis.

While the media trumpets that the sales increase adds to signs of a broadening housing market recovery, as we pointed out previously, it is not translating through to the economy. More importantly, the current levels of sales, while up from the lows, can hardly be called a recovery relative to previous normal activity levels. However, I digress; let's get back to the data.
In the month of September we know that 31,000 homes were sold nationwide. Terrific. What is more important to know is what TYPE of homes were sold. There are two ways to look at this - price and stage of completion. The first chart below shows the number of new homes sold by price level.
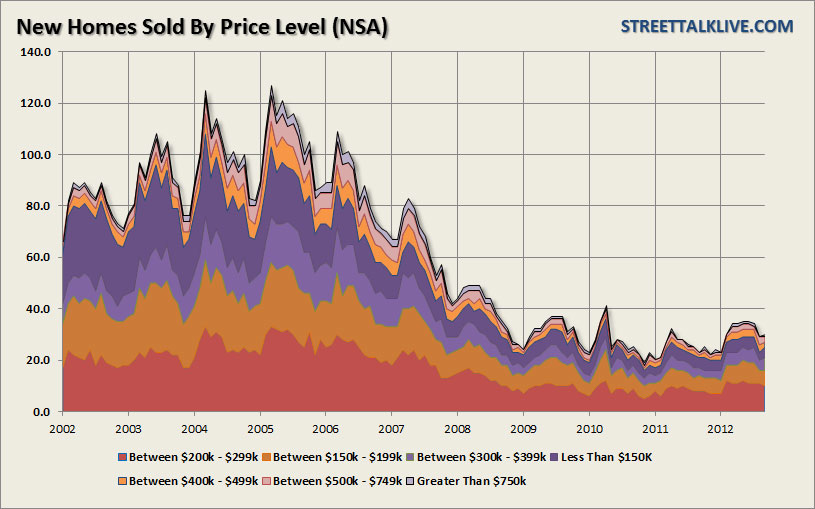
In the month of September there were:
- 4,000 sales in the sub-0k range - up 1,000 from August
- 6,000 sales between 0k-9k - up from 5,000 previously.
- 10,000 sales between 0k-9k - DOWN from 11,000 in August.
- 5,000 sales between 0k-399k - up from 4,000 previously.
- 2,000 sales between 0k-9k - DOWN from 3,000 in August
- 2,000 sales between 0k-9k - DOWN from 3,000 in August.
- 1,000 sales above 0k - up from ZERO in August.
(Note: These numbers are rounded which is why there is a 1,000 sales difference between the breakdown and the total new sales of 31,000 in September)
As you will notice 2/3rds of all sales are occurring in the lowest priced homes. The benefit provided by the Fed's exceptionally low interest policy is allowing for purchases of more expensive priced properties (the 0k-9k properties) while wages have remained stagnant in recent years. This is why any real rise in borrowing costs will quickly suppress purchases at the upper end of lowest 1/3rd of priced homes as home buyers are priced out of more expensive homes. Remember - individuals buy "house payments" and not "home prices."
The next chart shows new home purchases by stage of completion - Not Started, Under Construction and Completed.

Out of the 31,000 new homes sold in September:
- 11,000 of the sales were "Completed" construction which was the same level as August but down from 12,000 in July.
- 10,000 were categorized as "Not Started" which was up 2,000 from August back to July levels.
- 10,000 were homes that were "Under Construction" which was down 2,000 from August and down 3,000 from June.
The point here is that real activity in the construction market remains at extremely low levels. While the media, and real estate industry groups, watch all the various types of housing data closely when it comes to the economy - it is the construction of new homes that have the most economic through put. However, as showed in our previous article on housing starts, there has been no pickup in residential construction employment as the demand for new construction remains at VERY suppressed levels.
When it comes to the reality of the housing recovery the following 4-panel chart tells the whole story.

While the media continues to push the idea that the housing market is on the mend the data really doesn't yet support such optimism. The current percentage of the total number of housing units available that are currently occupied remains at very depressed levels. Furthermore, occupancy has only risen slightly from its recessionary lows. However, the increases in the occupancy rate have primarily been filled by renters which has surged to nearly 30% of all housing units. Owner occupied housing remains just a smidge above its lows while vacant housing units remains near its peak. With home ownership today at its lowest levels since 1980 - this can hardly be called a housing market in recovery.
There is another problem with the housing recovery story. It isn't real.
The nascent recovery in the housing market, such as it has been, has been driven by the largest amount of fiscal subsidy in the history of world. From bond buying programs to suppress real interest rates, modification programs and tax credits to artificially boost demand, and the Central Banks ultra-accommodative monetary policy stance it is not surprising that housing has ticked up. The problem, however, is that for all of the financial support and programs that have been thrown at the housing market - only a very minor recovery could be mustered. What happens when those supports are removed? Or maybe the real question is whether these supports CAN be removed?
Regardless, without full-time employment growth at a rate greater than population growth, real wage recovery, and a deleveraging of the household balance sheet, there cannot be a lasting recovery in housing. With household formation at very low levels and the 25-35 cohort facing the highest levels of unemployment since the "Great Depression" it is no wonder that being a "renter" is no longer a derogatory label.
Source: Street Talk Live


