This morning’s data on payrolls and unemployment from the Bureau of Labor Statistics was a strong report. The question is whether it is sustainable.
I like to look at the actual data rather than the seasonally adjusted data to get an accurate picture of what’s going on. It’s a choice between real numbers that tell us where we really are and imaginary ones that make it impossible to make accurate comparisons, since they don’t represent the actual number. February is a month where the seasonal adjustments actually result in a gross understatement of job gains. Using the actual number, it’s a very simple matter to compare this month with last month, and then compare the month to month change with past years in order to get a sense of how things are progressing.
The actual unemployment rate fell to 16.7% in February, including marginally attached workers and those working part time but wanting full time work. This is down from 17.3% in January and 17.9 % in February of 2010. The February 2010 decline was just 0.1%. The average February decline for the years 2001-2011, excluding the collapse year of 2009 was 0.3%. This year’s drop of 0.6% is a strong performance.
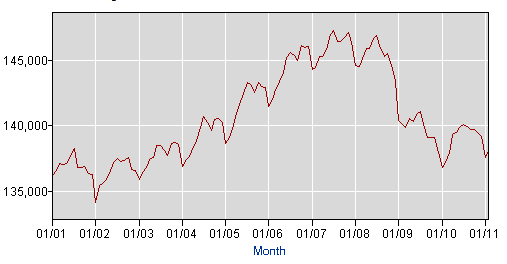
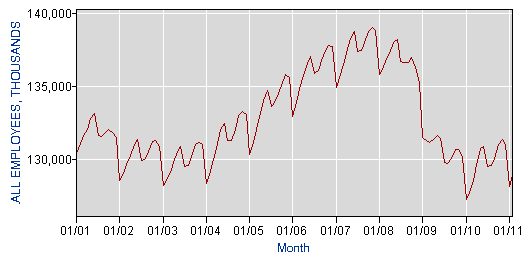
Total employment rises 494,000 month to month according to the household survey. This is a fairly normal seasonal uptick for February. It was 100,000 better than last February’s gain and slightly better than the average February gain of 461,000 since 2001, excluding 2009’s sharp drop.
The establishment survey showed a year to year gain approximately 1.25 million. Most of the gain was this month, with a jump of 816,000. The average gain in February for 2001 to 2011, excluding 2009, was 636,000, so again this was a good performance.
Average weekly hours worked fell to 33.9 from 34.2 month to month, up from 33.6 in 2010 but below 2009’s 34.2. The government has tracked this statistic since March 2006. It showed a gain in February 2007, 2008, and 2009, but a decline last year, and a bigger decline this year.
Off the 494,000 gain in total employment indicated by the household survey, just 358,000 were full time jobs. This is better than last year when the February gain was 323,000, but not as good as the last non recessionary year, 2006, when the gain was 428,000. The average gain from 2001 to 2011, excluding 2009 when the economy collapsed, was 281,000. All in all, this is a positive number.
So we’re having a party on borrowed, printed money. If this is what 0,000 billion a month in government deficit spending and another 0 billion a month in Fed printing will buy you, the question becomes what happens when they pull the punchbowl. The real test of sustainability of these gains will come when QE2 ends and government stimulus programs wind down over the next few months.
I think that this is as good as it gets. This presents a golden opportunity to get out of the market when the getting is good. Apparently some savvy traders have already made that decision this morning.
Source: Wall Street Examiner
Stay up to date with the machinations of the Fed, Treasury, Primary Dealers and foreign central banks in the US market, along with regular updates of the US housing market, in the Fed Report in the Professional Edition, Money Liquidity, and Real Estate Package. Try it risk free for 30 days. Get the research and analysis you need to understand these critical forces. Be prepared. Stay ahead of the herd. Click this link and get in RIGHT NOW!


