Every 3 months the Census Bureau releases an interesting survey of US housing inventory and vacancy for both owner occupied and rental housing. I include a review of this data along with the shorter term and real time indicators on the owner occupied housing market in my proprietary housing updates. The last Census Bureau survey was released at the end of January covering the fourth quarter, so this review is a tad tardy, but don’t worry, the real time supply and demand indicators have not improved since the fourth quarter, and in some respects have gotten worse. The inventory to contracts ratio appears to be heading for a record high for February. So the conclusions drawn from the Census Bureau’s fourth quarter data are still very much valid and they are not pretty.
Census Bureau Quarterly Housing Survey
The Census Bureau’s Housing Vacancy survey for the fourth quarter of 2010 showed a small decline in year round vacant inventory versus Q4 2009. However, while for-sale inventory was down slightly and rental inventory declined significantly, there was a big jump in units held off the market for reasons other than seasonal occupancy or usual residence elsewhere. This category is now up by approximately 850,000 units since Q4 2006, and 115,000 since Q4 2009. My surmise is that most of this is bank REO inventory. This inventory would be for sale but the institutional owners are delaying putting the houses on the market, hoping for better conditions or at least trying not to exacerbate the situation.
While the total number of occupied housing units grew by nearly 1.1 million units year to year the entire gain was in rental housing. The number of owner occupied units has been flat since 2008 and is down since 2006.
As the chart below suggests, the year to year stability in the number of vacant for sale units appears directly attributable to the increase in units held off the market by the banks. Otherwise, vacant inventory for sale would be higher. Futhermore, the chart suggests that before a true recovery can take hold, the homeowner vacancy rate would need to reverse to below 2.5% and move back toward the generational norm of 1.5%. Failing that, the oversupply is likely to continue to pressure prices.
The growth in the blue line at the bottom of the chart represents “shadow inventory.” When viewed in conjunction with Vacant For-Sale inventory that is at a historically high level and is not coming down, it’s alarming.
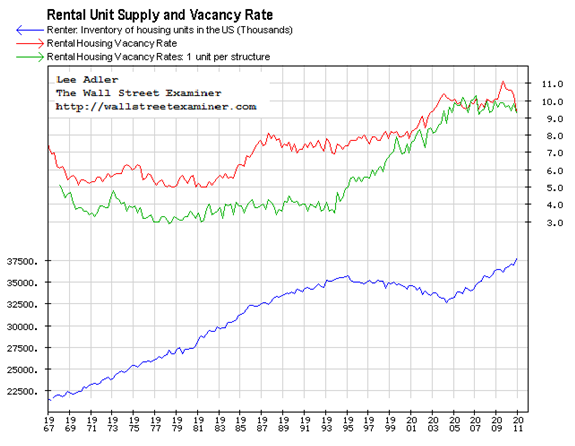
The only drop in vacancy has come from the rental market, which remains oversupplied even after this reduction. Even that decline in vacancy came only as a result of a sharp drop in the vacancy rate of multi-family buildings. The multifamily vacancy rate declined from 13.1% in the third quarter of 2009 to 10.4% in the fourth quarter of 2010. While I question the accuracy of that data, I’ll accept it for now. 10% plus is still a lot of vacancy.
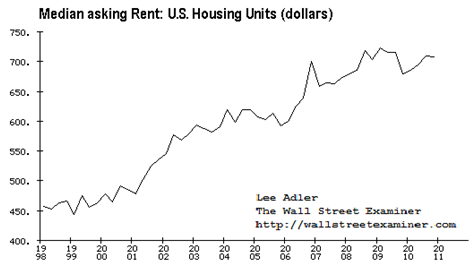
By the same token, the vacancy rate of single family rentals has remained stuck between 9% and 10% since 2004. This is a structural glut that shows no sign of receding. The shadow inventory of single family homes waiting to come on the market will add to both for-sale and rental inventory, and could trigger a downward spiral in rents. That would be catastrophic for the institutions who are the biggest owners of these properties. That includes insurers, pension funds, and REITs.
The supply problem is not going away. That’s because gross demand is still poor, thanks to weak employment and the resulting increase in extended or combined family households. We may also be experiencing a wave of out migration, as immigrant workers who cannot find work return to their home countries. The supply problem will only begin to be mitigated when total employment returns to a sustained growth path.
Growth in the total number of occupied housing units has been slowing since 2005 when it peaked near 2 million units. In 2009 near the trough of the recession, total housing absorption went negative by an annual rate of 250,000. Total occupied housing units had actually declined by the middle of 2009 . As the total number of employed persons upticked in the first half of 2010, absorption again turned positive, but employment slumped sharply in the second half of the year. Reduced housing absorption is likely to follow. The size and durability of the seasonal uptick in employment in the first half of this year will have a lot to say about whether absorption remains on a sustained path or drops back toward zero.
The best data we may have for the purpose of estimating whether total employment is picking up enough to boost housing may be the Federal Withholding tax data that I feature in the Treasury Report, and secondly the BLS non-farm payrolls data. The uptick in employment in the first half of 2010 wasn’t sufficient to reduce housing oversupply. Recent withholding tax data suggests that total employment may be leveling off. March is when employment usually strengthens. This will be a critical month. Without strong, sustained growth in employment, there will be no housing recovery.
It remains to be seen if the billion a month of money printing remaining under QE2 will cause employment to expand, and whether that would be sustainable after the pumping ends. Moreover, we are a long way from achieving the kind of employment recovery that’s likely to result in a meaningful absorption of the housing oversupply. Employment increased in early 2010 and the effect on housing absorption was minimal.
So here are a few simple facts. As of the fourth quarter of 2010 there were 6.1 million vacant housing units available for rent or sale in the US. Another 3.6 million were held off the market. This is shadow inventory that could be released at any time, either if there are signs of recovery, or if financial pressures worsen. Taken together, that’s 9.7 million vacant units.
This doesn’t count units occupied by squatters who have long since stopped paying their mortgages. No one knows exactly what the numbers are, but we can make an educated guess. According to the NY Fed, there are approximately 100 million mortgages in the US. Fannie and Freddie report that roughly 4.5% of the mortgages in their portfolios are “seriously delinquent.” That’s another 4.5 million currently occupied units that could be added to shadow inventory, bringing the potentially available inventory to 14.2 million units.
Over the past several years the absorption rate of for-sale properties has been zero. The absorption rate of rental units has averaged 600,000 units per year since 2006. Absorption is tied to employment. If you assume that employment will grow slowly, then the total absorption rate might grow to one million units a year. That means that there is “only” a 9.7 year supply of units currently on the market, or waiting to come on the market, not counting the 4.5 million units currently occupied by non-paying squatters.
And what if the normal seasonal recovery in employment is weak. What if total employment growth remains weak for several quarters? Then absorption rates could sink back toward zero as extended families recombine or, in other words, your unemployed cousin shows up to sleep on your sofa for an “visit” just until he can “get himself situated.” The oversupply would grow.
Whether you want to own the home-builders (XHB) or apartment REITs like AIV, AVB, and EQR should depend on whether you believe not only that employment will skyrocket in the next 12 months, but also whether you want to recognize the fact of those 9.7 million empty units with another 4.5 million waiting in the wings.
The charts of XHB, AIV, AVB, and EQR are in uptrends that have extended for months on weakening momentum. There’s nothing unusual there. The whole stock market looks like that. In the old days we called that distribution.
The rallies were initially based on signs of economic recovery, but those signs have been waning as the Fed’s QE2 runs into the problem of diminishing marginal returns and unwanted feedback effects. If you want to believe that this is just a momentary pause in a solid and lasting recovery, then fine. You are certainly free to ignore the data and make up whatever facts suit your bias. But if you think as I do that the problems of massive oversupply and weak absorption are real and are about to rear their ugly heads in the market, then maybe it’s time to short ‘em to zero! Because based on the forces apparent in the data, unless there’s a miraculous reversal of the trends, some of these guys will go broke.
Housing bulls want you to both believe in both a strong employment recovery and that the oversupply is not a problem. That’s just pie in the sky. The bull runs in the home-builders and apartment REITs have been based on false assumptions, and in many cases, false data made up by industry shills. It’s time to get off that train.
All charts and tables sourced from most recent US Census Bureau data.
This post originally appeared here.
Stay up to date with the machinations of the Fed, Treasury, Primary Dealers and foreign central banks in the US market, along with regular updates of the US housing market, in the Fed Report in the Professional Edition, Money Liquidity, and Real Estate Package. Try it risk free for 30 days. Don’t miss another day. Get the research and analysis you need to understand these critical forces. Be prepared. Stay ahead of the herd. Click this link and get in RIGHT NOW!


