


This week’s article is the second part of a series with the goal of softening longer-term bearish investing biases. In last week’s article (click for link) I stated that I feel we remain locked in a secular bear market until the middle of the decade (note: secular cycles are comprised of several cyclical stock market moves), with one more bear market ahead of us before we begin another secular bull market. Unless the perma bear crowd softens their bearish investment mentality they will not be ready to jump on the bargains that will present themselves AFTER the next bear market. We are likely in the later innings of the secular bear market that began in 2000 and thus it makes sense to begin to transition our investing philosophy to the light that is at the end of this secular bear cave. A few potential catalysts will be presented below as to why a new secular bull market may begin.
Every Beginning is Some Other Beginnings End
Perhaps the most influential strategist that has shaped my macro and secular views is Barry Bannister, Managing Director at Stifel Nicolaus. Mr. Bannister nailed the macro call of hard assets (commodities) versus paper assets (stocks, bonds) in an 87-page report back in 2002 when he worked for Legg Mason. He made the call for an inflation cycle occurring from 2002-2015 amid strong growth from China (see image below):

Source: Barry Bannister, 1Q11 Macro-Trends: Early Reflation Feels Like Growth
Given we are in the later stages of his secular time window, Mr. Bannister now favors U.S. growth stocks over commodities from a long-term investment perspective. When looking at long-term returns (10-year compounded growth rates) of commodities versus stocks we can see that commodity inflation is near the upper end of its range seen over the last 200 years while stock returns rest near the bottom of the last 150 year range (see image below). For this reason value investors such as Jeremy Grantham of GMO and Mr. Bannister are warming up to large cap blue chip growth companies over commodities.
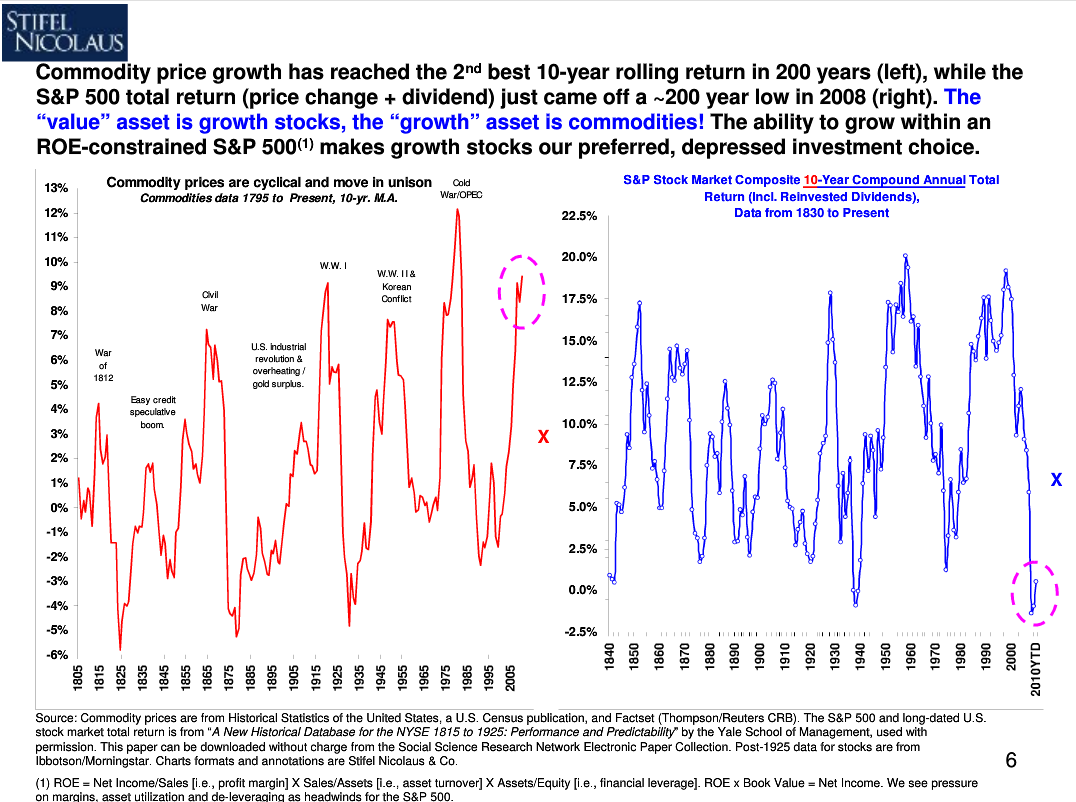
Source: Barry Bannister, 1Q11 Macro-Trends: Early Reflation Feels Like Growth
Part of the reason Mr. Bannister is bullish on the stock market over the next ten years is that the average secular bear market has lasted 14 years which puts the end of the current one in 2014. This is, again, why I feel we are in the latter innings and why it's time to soften bearish longer-term views on the stock market. One interesting point that Mr. Bannister makes is that the nominal (not adjusted for inflation) price low during a secular bear market occurs near the middle, not the end. This phenomena can be seen below for the last three completed secular bear markets over the last 100+ years. Mr. Bannister believes the nominal price low for our present secular bear market occurred at 6 on the S&P 500 back in March 2009.

Source: Barry Bannister, 1Q11 Macro-Trends: Early Reflation Feels Like Growth
Recession Flags Are Rising
While I feel a new secular bull market is not too far off (2014-2015), I believe we have at least one more bear market between now and then. The median cyclical bull market within a secular bear market lasts 371 days and the present cyclical bull market that began in 2009 is now 875 days old, which is why the risks of a bear market occurring are obviously increasing. I believe the markets will peak this year since the economy is not able to support its own weight without the twin crutches of monetary and fiscal support, both of which have or are winding down. I also believe a bear market will most likely begin this year and ends in 2012 accompanied by a recession.
Currently our recessionary probability model suggests only a 13% chance of a recession occurring in the next 6 months, but we are now only 7% below the key 20% level which, once breached, has led to only one false recessionary warning signal over the last three decades. Risks are rising by the day as more and more key indicators are flashing recession warnings.

Source: Bloomberg
One of my favorite economic breadth charts for the U.S. is the Philadelphia Fed’s State Coincident Index which measures coincident economic activity for all 50 states. The Philly Fed also calculates a one-month diffusion index with 50 representing a key threshold. Once the 50 level is breached to the downside after an economic expansion we have ended up in a recession every time except for last year when the markets and economy reversed as the “Bernanke Put” was in play with QE2. The current reading for June came in at 34 and is decisively below 50. We will have to see if it gets revised and what July’s reading shows. Further deterioration is obviously not bullish for the economy or stock market.

Source: Bloomberg
One other indicator that has had one of the best recession call track records is the Chicago Fed’s National Activity Index which is comprised of 85 monthly national indicators. Readings below -0.70 for the three month moving average represent recessionary territory and sustained moves below -0.70 have encapsulated all of the recessions over the last forty years. Thus, the current reading of -0.60 puts the U.S. economy on the brink of entering into a second recession.

Source: Bloomberg
Potential Secular Bull Market Catalysts
If I am correct that we will enter a bear market with accompanied recession in the U.S. in the next 6-12 months then capital preservation should take center stage so that investors have capital (cash) available to pick up the bargains that come as a result of bear markets. The 2007-2009 bear market produced exceptional value in stocks where 90% of the Dow Jones Industrial Average stocks reached 21-year price-to-earnings (PE) ratio lows and 80% of the Dow witnessed single-digit PE multiples. Given the damage done to investor’s psyche from witnessing stocks collapse, many investors looked at the stock market like a plague and dove head first into the bond market rather than scooping up the value witnessed in the stock market. Again, the purpose of this and the last article is to shift investors mindset to a brighter longer term outlook so that when the bargains reappear they will not be frozen with investment paralysis. To help change investors longer term outlook on stocks, two potential catalysts to bring about a new secular bull market are presented below.
Weak USD = Strong Exports and Foreign Profits
One of the things that have baffled Main Street is how the stock market could be performing so well while the economy remains incredibly, i.e. poor employment, income, and housing. While part of this confusion is the stock market serving as a sinkhole for the Fed’s monetary largesse, part of the explanation also stems from the fact that more and more large corporations have a greater global footprint and are less dependent on the U.S. economy for their profit. This dichotomy can be seen below when comparing the ISM’s Manufacturing PMI that has a larger corporation emphasis versus the National Federation of Independent Business’s Small Business Optimism Index. The divide between the two surveys is as wide as we’ve seen it over the last two decades. Clearly corporations with a global footprint are witnessing stronger demand overseas than here stateside and are thus fairing better than their small-sized brethren whose revenue comes nearly 100% from within our borders.
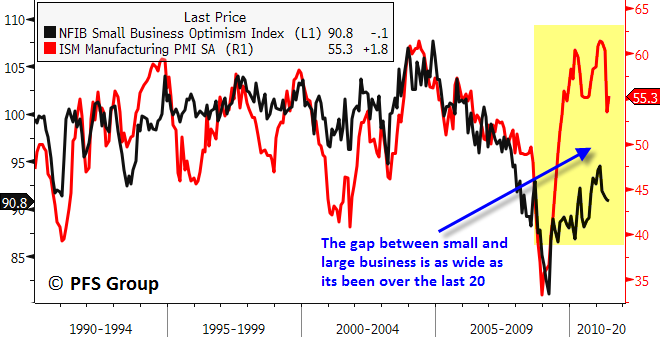
Source: Bloomberg
Many investors would be surprised to find how much revenue and earnings for U.S. stocks come from overseas operations. For example, the average percentage of revenue coming from foreign countries for the Dow 30 stocks is 50%, with the highest example coming from Intel Corp (INTC) who derives 85% of its revenue outside the U.S.
Dow Industrial Average Components & Foreign Revenue

Many large corporations that export their products overseas are direct beneficiaries of a weak USD since U.S. products costs less to foreigners when their currencies appreciate relative to the Greenback. Intel provides a great illustration of this. Shown below is Intel’s trailing 12 month earnings-per-share (EPS) along with the USD Index inverted for directional similarity. Notice the trends in the USD Index leading the trend in Intel’s earnings.

Source: Bloomberg
On a national level, we can see how the USD directly relates to national export activity. Shown below is the USD Index inverted along with the ratio of U.S. exports to GDP. In terms of the economy, it's no small coincidence that the share of economic activity that exports represents sits near a multi-decade high while the USD Index rests at multi-decade lows.

Source: Bloomberg
Given the large structural financial imbalances of this country and the easy monetary and fiscal policy by the Fed and government, the USD will likely remain weak relative to its major trading partners and a weak USD directly benefits the large cap corporations within the S&P 500 and Dow Jones Industrial Average that have significant global exposure. The trend of increasing global exposure by large corporations makes sense given emerging and developing countries growth rates are expected to exceed the developed countries well into the decade according to the IMF.

Source: IMF
To give readers a sense of how significant a weak USD and foreign exposure are to corporate profits, below are a few excerpts from recent quarterly earnings (emphasis added):
Highlights from YUM’s Q2 Conference Call: Continued Overseas Growth
Our second quarter was still a tale of two cities only amplified. As David described, we had simply outstanding results in China while U.S. performance was poor. Yum! restaurants international performance was solid and we also benefited from a lower tax rate than last year. When you add it all up, EPS growth totaled 13% excluding special items. China produced simply an outstanding quarter with 25% operating profit growth fueled prior to foreign currency translation.
Fed’s Recovery Forecast Buoyed by Dudley Expecting Dollar-Driven Exports
“We must and we will implement a new strategy to expand our position and drive our growth in international markets,” Morrison said at a July 12 meeting with investors. “The rise of the middle class in large developing markets like China and India” represents a “growth opportunity of staggering proportions...”
U.S. shipments overseas reached a record 5.8 billion in April and were 4.9 billion in May, benefiting companies from Midland, Michigan-based Dow Chemical Co. (DOW) to Deere & Co. (DE) in Moline, Illinois, according to data released by the Commerce Department in Washington last week. Deere, the world’s largest maker of agricultural equipment, said June 30 that sales of tractors and machinery to farmers in Brazil are rising, buoyed by high commodity prices…
Wolverine World Wide Inc. (WWW), the Rockford, Michigan-based shoe company whose products include Hush Puppies, reported a “double-digit” revenue increase in “every major geographic region” in the second quarter, Blake Krueger, chief executive officer, said on a July 12 earnings conference call.
It’s “a very good time to be diversified and to have our brands in more than 190 countries and markets around the world, as the pace of the economic recovery in most global markets has been faster than in Europe or the United States,” Krueger said…
Food-service demand remained weak as high unemployment kept people away from restaurants, Chief Executive Officer Joe Sanderson said at a May 17 conference a week before the company reported a net loss of .3 million. “But we’ve seen improvement in the export market every month since January.”
It is the continued stronger growth in overseas markets coupled with a weak USD that are likely to propel large-cap blue-chip companies earnings who have exposure to the global economy, particularly the emerging nations like the BRICs (Brazil, India, Russia, China). These are the type of investments that Barry Bannister and Jeremy Grantham feel provide the best long-term returns at the present time. Next to timber and emerging markets, Jeremy Grantham’s firm believes US high quality companies provide the best returns over the next 7 years, with U.S. small cap companies who have a greater exposure to the U.S. market, providing the worst returns over the next seven years.

Source: GMO
Asset Class Secular Cycles & The Lesser of Two Evils
Often at times when one asset class is in a secular bear market another is in a secular bull market. This is most commonly seen between hard assets and paper assets where commodities outperformed stocks and bonds in the inflationary 1970s and the last decade, while underperforming in the 1950s-1960s and the 1980s-2000. Already shown above was the 10-year annualized return in commodities and stocks by Barry Bannister which shows that stocks are near the lower range of their 100+ year historical results while commodities are near the upper end of their 200+ year range. Given the continued industrialization of emerging countries with China chief among them, it is unlikely that commodity demand will go into a prolonged slump any time soon. That said, the pace of demand may slow as the developing nations undergo austerity measures to improve government debt levels. This will likely cut into the exports to these countries by the emerging markets, and thus slow the growth in general commodity demand in the years ahead. As financial capital is always seeking the investment that provides the greatest return for unit of risk, large blue chip companies with exposure to global markets will likely benefit as some capital previously directed towards commodities finds a new home. Again, while I continue to feel the commodity secular bull market that began in 2001 is not over, global austerity measures are likely to cut into commodity demand and slow the pace of price appreciation, benefiting other asset classes like large blue chip US companies. While a slowdown in price appreciation in commodities may benefit blue chip stocks, there is another asset class whose longer-term performance is likely to benefit large cap stocks even more, which is the bond market.
The secular bull market in bonds took off when former Fed Chairmen Paul Volker drove U.S. interest rates into the mid to high teens. From there the general trend has been a decline in bond yields and concurrent rise in bond prices. This trend continued for decades and ended with a bang during the 2008 financial crisis in which bond yields spiked lower. The similarity between the NASDAQ’s blow off peak in 2000 to the bond blow off peak in 2008 is seen below, with 30-Yr UST yields inverted for directional similarity.
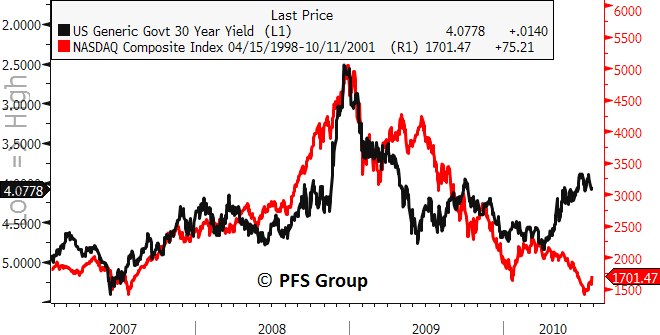
Source: Bloomberg
The two bear markets that stocks witnessed over the last decade and the blow off peak in bonds in 2008 pushed the 10-year return differential between stocks and bonds to more than a half century low. This can be seen in the figure below courtesy of Ned Davis Research which shows that the S&P 500 hasn’t underperformed the UST bond market over a ten year period to this degree since WWII. Of note in the figure below is that stocks in the present secular bear market underperformed bonds more than they did in the prior two secular bear markets. Thus, it is highly unlikely that the place to be is the bond market over the stock market in the next ten years.

Source: Ned Davis Research
The UST market is greater in size than the U.S. stock market, and so capital flows out of the bond market into the stock market could be a major catalyst to ending the secular bear market in stocks. While the Fed is artificially keeping interest rates near generational lows, there will come a point where inflation heats up to force the Fed’s hand on the short end of the yield curve while the bond vigilantes could step in at a moments notice to drive up the long end. As losses in the bond market begin to pick up investors are likely to head for the exits in search of better returns. If the bond bear market builds momentum due to rising inflationary pressures some of the capital from bonds will find its home in gold bullion, but there is only so much bullion to go around and it is quite likely some of the asset flows will be driven to U.S. equities.
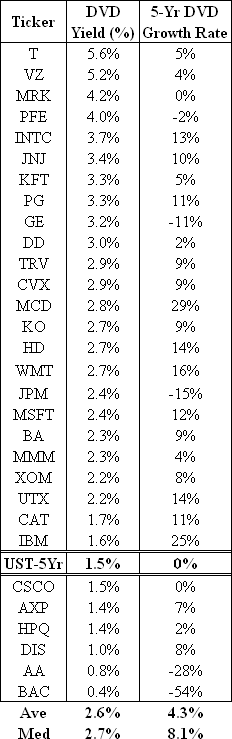
Think about it for a moment, what would you rather invest in for the next ten years, a 10-Yr UST yielding 2.78% or a blue chip Dow stock like Proctor & Gamble with a dividend yield of 3.3% and a 5-year compounded dividend growth rate of 11% that is more than three times the inflation rate and does not provide a flat income stream like UST?. More than 80% of the stocks within the Dow have higher dividend yields than a 10-Yr UST, and have sizable dividend growth rates to boot. As baby boomers move into retirement they are going to need income from their savings and the UST market just isn’t going to cut it, with solid blue-chip high dividend paying companies like those in the Dow providing great alternatives.
Outside of yield comparisons, the continued deterioration in the U.S.’s fiscal position is increasing the inherent risk of owning US debt and making large blue chip companies all the more attractive. Interestintly, the market is pricing in a lower probability of default for the corporate debt of the Dow components than the Treasury market. The median Dow corporation has a 5-year credit default swap (CDS) level of 54.6, which is just barely above the 54.1 level for a 5-yr UST. Half of the Dow Jones Industrial Average corporations are now being priced by the market to have a lower default risk than the US government, which is something once viewed unthinkable!

Viewing U.S. stocks as a more attractive alternative to UST debt is already something being argued by the Chinese as the following article illustrates.
China Should Buy U.S. Equities Instead of Treasuries, Economist Xie Says
China should buy U.S. stocks instead of Treasuries as they may be safer investments amid concerns about a U.S. debt default or credit-rating downgrades, according to Andy Xie, an independent economist.
“The U.S. stock market can be a credible alternative,” Xie, 50, formerly Morgan Stanley’s chief Asia economist in Hong Kong, said in an interview in Bloomberg’s Shanghai office yesterday. “U.S. companies are reporting strong earnings and they are selling a lot to emerging markets. Even though U.S. stocks aren’t cheap by historical standards, they are a better investment relative to Treasuries..”
Xie favors U.S. energy and agriculture companies because of rising demand for commodities from emerging markets, he said, without naming any stocks. Since leaving Morgan Stanley, the former World Bank economist has worked as a fund adviser and written opinion articles for Caixin Media Co., a Chinese financial news company, and Bloomberg News.
“China should buy U.S. stocks,” Xie said. “Stocks are better than bonds.”
Europe’s sovereign debt crisis took center stage beginning in 2009 when the market priced a higher default rating on W. European sovereign debt than they did on W. European corporate debt. Since 2009 capital has been fleeing the W. European sovereign debt markets and seeking a home elsewhere, with some of that capital moving into the equities and corporate debt markets and into gold. It was this move in Europe and a repeat in the U.S. ahead that I penned an article earlier in the year titled, “When is it Time to Buy Gold? When corporations are more creditworthy than their governments!”

Source: Bloomberg
It appears that just as the US consumer has had to come to grips with their fiscal situation and ratchet in their debt accumulation and consumption, that day of reckoning for the US government may be fast approaching. If the US doesn’t get its financial house in order the bond vigilantes will by voting with their wallets and capital will flee the US Treasury market. If at the same time the USD remains weak against global currencies then parking their capital in cash will be a losing proposition and they will seek a home elsewhere. The greater dividend yields over US Treasuries and healthy dividend growth rates compared to flat fixed income UST bonds will cause high quality large cap blue chips with exposure to economies overseas to standout as a solid investment alternative.
Summary
Today’s and last week’s article have tried to paint the picture that it rarely serves to be an investor with only one type of mindset, whether being permanently bearish (“perma bear”) or permanently bullish (“perma bull”). Given investors have witnessed not only two bear markets in stocks but also the greatest housing crash in over a 100 years, its understandable that the perma bear ranks have swollen. However, being permanently bearish on US stocks has caused a great deal of investors to miss out on incredible opportunities that were afforded to them from the 2007-2009 bear market. We are likely to be given another value opportunity ahead as the present bull market is beyond its prime and nearing retirement, and unless the perma bear crowd softens their bearish long-term positions they will miss out on the next opportunity as they did on the last. Investing is often not so much about choosing the best opportunity, but about not choosing the worst opportunity. When viewing the U.S. stock market in this light relative to the UST market, particularly the large cap blue chip companies with a strong foreign footprint, it is highly probably that over the next ten years the worst asset class title will go to USTs, not high quality US stocks.


