


With zero-bound interest rates in the U.S. and depressed short-term rates in other developed nations, monetary tools historically used by central banks have lost their usefulness as well as their tendency to lead major economic and market turning points. Despite the constraints against using short-term rates to massage the business cycle, we still have record economic and market volatility driven by other variables that help to explain these violent swings. Francois Trahan, co-author of "The Era of Uncertainty" and head portfolio strategist at Wolfe Trahan, has identified what he believes is the chief variable explaining economic and financial market swings, coining the phrase, "Inflation is the new fed funds rate."
In the past, the Fed raised short-term interest rates to cool the economy and often a recession would ensue, while it lowered them to stimulate the economy back towards growth. This central bank tool in an era of zero-bound interest rates has been replaced by the effects of inflation on the business cycle. Like rising interest rates, rising inflation has turned into a bearish force that eats into discretionary spending while falling inflation puts money back in consumer's pocket books and helps to stimulate economic growth. As such, monitoring real-time and lagging inflation indicators can help investors in navigating the market's rollercoaster-like swings and right now various indicators suggest that inflationary pressures are starting to build and will likely exhibit their influence on the economy as we enter summer, which will likely lead to an intermediate top in the markets and U.S. manufacturing sector. Current rising inflationary pressures are signaling the countdown to the next significant peak in the market has begun.
The Window of Opportunity Is Closing
Using Francois Trahan's thesis that "inflation is the new fed funds rate," I argued in my October 2011 article, "A Window of Opportunity," that we were likely to see a manufacturing-led recovery in the U.S. heading into 2012 despite the rampant bearish sentiment and recessionary calls at the time. The conclusion from that article is provided below:
If we do get a manufacturing rebound heading into 2012, it is conceivable that investors have a window of opportunity for gains heading into year-end before the bearish longer-term indicators from the ECRI begin to take hold again. If the prices paid indexes begin to rise sharply once again, that will suggest this window of opportunity is closing.
One of the figures I used in my October article showed how the prices paid indexes measuring inflationary pressures for regional manufacturing surveys lead by roughly six months ahead of the headline indexes. Because inflationary pressures at the time were falling rapidly from their spring 2011 highs I argued that we would see a manufacturing recovery heading into 2012. The falling inflationary pressures were akin to falling interest rates which helped to stimulate the economy heading into 2012, which the stock market has discounted and risen accordingly. It was these indicators along with a few other ones that Francois Trahan argued "why stocks will go higher in first half of 2012."
Fast forward to today, these same prices paid indexes have begun to tick higher as inflationary pressures are building once more and suggests that the economy may stall as we enter summer with the stock market likely to discount the economy's weakness by also hitting a wall by summer. An updated version of the figure shown in October is provided below with the prices paid indexes (red lines) shown on the right y-axis and inverted (for directional similarity) and advanced six months ahead of the headline indexes shown on the left column (black lines).

Source: Bloomberg
ECRI Recession Call Coincides with Major Inflection Point
In my October article I highlighted that the picture painted by the ECRI heading into 2012 was vastly different than it was heading into 2011. Back in the fall to early winter of 2010 the stock market was coming off of a sizable 17% correction (just shy of bear market territory) and talk of a double-dip recession in the US abounded. Contrary to the consensus view at the time, the ECRI came out and publicly declared there would be "No Double-Dip Recession," making the call because their long-leading indicators were still bullish. Fast forward one year, in the fall to winter of 2011 the ECRI made a vastly different prognostication by saying the U.S. was now tipping into a recession ("Explaining the Recession Call").
I argued in my October article that, while the ECRI's long-leading indicators suggested the US was tipping into a recession, short to intermediate-term indicators suggested a recovery and that the ECRI recession call was likely on pause until both the long-leading and short to intermediate-term indicators pointed in the same direction, which I called a "Window of Opportunity".
ECRI head Lakshman Acuthan came out today on several financial networks and reaffirmed their recession call ("ECRI Reaffirms Recession Call: Data Has Gotten 'Worse, Not Better") in which he believes the US will fall into a mild recession by mid-year.
As highlighted above, the indicators I used to make the case for an intermediate-term recovery in the economy as we headed into 2012 are also arguing for a slowdown to begin as we enter summer, right when the ECRI believes the US will slip into a mild recession. This summer may serve as a major inflection point in which the ECRI's long-leading economic indicators align with short and intermediate-term all pointing south.
Rising Oil Prices are the Economy & Market's Achilles' Heel
If inflation truly is the new fed funds rate, then decomposing the Consumer Price Index (CPI) may prove useful and Trahan has pointed out that the most volatile components of the CPI are the food and energy components which explain a great deal of the CPI's swings. One of the main factors that help explain the variability in the CPI is oil prices and using Trahan's logic of inflation acting as the new fed funds rate, oil could be considered the big swing factor for the business cycle. Expanding upon Trahan's thesis, Jim Puplava penned an article ("The Petro Business Cycle") which explains the impact of energy prices on the economy and the business cycle.
Highlighted below are the annual rate of change in oil prices (red line, shown inverted and advanced), the S&P 500 (black), and the ISM Manufacturing PMI (blue line). The rate of change in oil prices leads the rate of change in both the ISM and the S&P 500 and the recent advance in oil is pointing to economic and market weakness by the summer. Note the two peaks in the red line for oil (again, shown inverted) which indicates we may see a small sell off in late spring followed by a subsequent sell off in early summer.
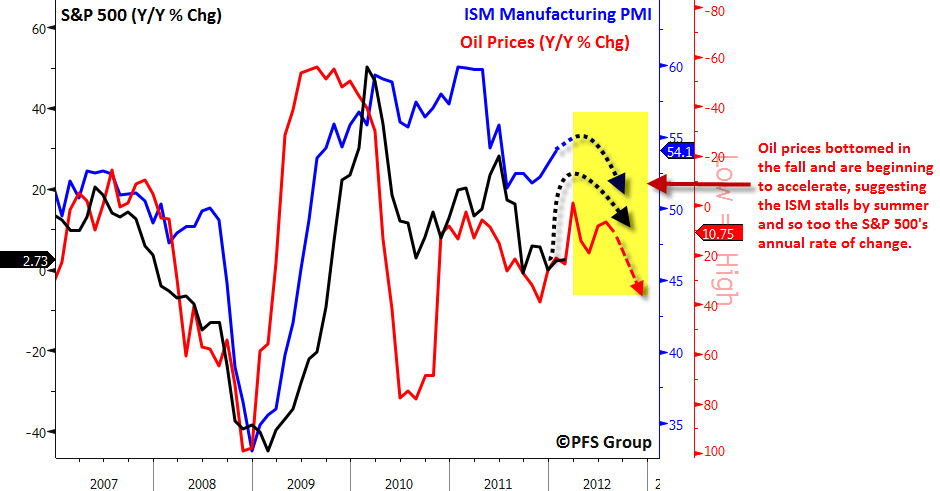
Source: Bloomberg
Why We TRULY Want a "Strong Dollar" Policy
US Treasury Secretary Tim Geithner has stated that he is for a "strong dollar" while also issuing record amounts of Treasury debt and therefore weakening the USD. The Treasury is not alone in exerting its influence on the USD as the Fed's balance sheet also plays a pivotal role on its strength or weakness. In Trahan's book, "The Era of Uncertainty," he argued that one of the biggest Fed blunders in the past decade was Bernanke's second round of quantitative easing (QE2) in 2010. His indicators at the time were pointing towards an economic rebound as were the long-leading indicators from the ECRI which said there would be no double-dip recession. Basically, the economy was set to recover without the help of the Fed and Trahan argued that Bernanke hinting at QE2 in his August 2010 Jackson Hole speech and then the actual initiation of QE2 at the end of the 2010 directly correlated with a peak in the USD and sparked a fire under commodity prices which resulted in surging inflation. It can be argued that had Bernanke not enacted QE2 that the growth collapse in 2011 may have been a lot milder with less market volatility and inflationary pressures.
The biggest catalyst for the recovery late in 2011 was the USD bottoming in the spring of last year which helped deflate the hot air in commodity prices and bring about easing inflationary pressures as commodities are priced in dollars and a rising USD correlates to falling/weak commodity prices.
I argued last month that the USD was likely forming an intermediate-term top ("Topping Dollar Likely Catalyst for Gold Breakout") and it has subsequently fallen and since that time commodities have responded in kind by strengthening. It is the strength in commodity prices and weakness in the USD that I believe is why the countdown to a market peak has now begun.
The current business cycle appears to be centered on inflation with the USD playing a pivotal role. The USD leads to commodity inflation (oil prices) which leads to general price inflation which leads to a manufacturing slowdown as consumers and business have less discretionary money to spend. Thus, a peak in the USD starts the clock for the next major market correction which is precipitated by surging inflationary angst that causes the economy to throttle back. This is illustrated in the figure below which shows the USD Index advanced alongside the ISM Manufacturing Index. The recent peak in the USD is projecting an ISM peak in late summer.

Source: Bloomberg
While Bearish Clouds May Be Forming, Sunny Skies Still Lie Ahead
Despite the countdown to the next significant peak in the market, we still have many months of strong market gains ahead of us in this "window of opportunity" and a quick check up on the market's health confirms this. As I highlighted in an article earlier in the month ("Stop Talking and Start Listening") the current message from looking at the market's breadth shows we are nowhere close to forming a market top. Market tops are a process and if we were approaching another significant peak we would see very weak participation in stocks actually go up with the market and the most cyclical sectors would be displaying price erosion relative to the stock market.
A system I introduced in my article earlier this month was to look at the trends in various moving averages and then apply this analysis to all 500 stocks within the S&P 500 to get the market's bill of health (see "Stop Talking and Start Listening" for further explanation of the moving average system). Shown below is my "Moving Average Trend Analysis" for the S&P 500 and I have defined uptrends as U2 and U3 while downtrends include D2 and D3. When looking at the S&P 500 as a whole, 79% of its members are in defined uptrends which represents a very healthy market advance. What is even more encouraging is that the most cyclical sectors of the stock market that are affected by economic swings are displaying the greatest strength. The financial sector leads with 95% of its constituents in defined uptrends followed by materials (90%), Industrials (87%), and technology (85%). The utility sector, which often outperforms in bear markets, shows the fewest percentage of members in uptrends with only 42% while showing 30% of its members in defined downtrends.

Again, if we were approaching a significant market top we would see very weak breadth as only a small group of stocks within the S&P 500 would be in defined uptrends with the cyclical groups showing the poorest breadth while the non-cyclical sectors like health care, consumer staples, and utilities would be displaying the strongest. That dynamic is clearly not present at this time and while current building inflationary pressures may be closing our window of opportunity by this summer, the markets current healthy breadth indicates we still have several more months to rack up some decent returns.


